Moody County, South Dakota
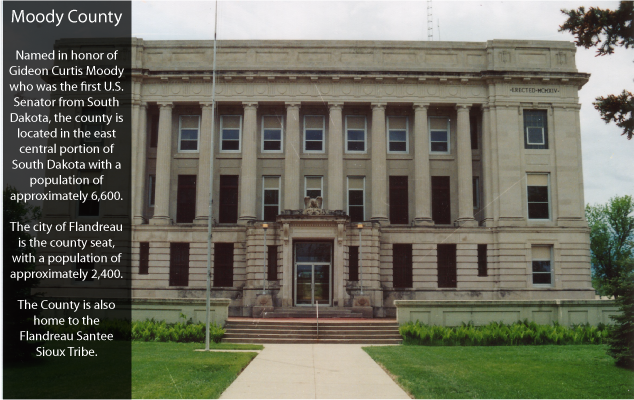
Moody County is a county in the U.S. state of South Dakota, United States. The population was 6,486 at the 2010 census.[1] Its county seat is Flandreau.[2] The county is named for Gideon C. Moody.[3]
Moody County | |
|---|---|
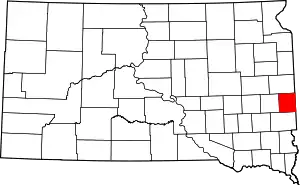 Location within the U.S. state of South Dakota | |
 South Dakota's location within the U.S. | |
| Coordinates: 44°01′N 96°40′W | |
| Country | |
| State | |
| Founded | 1873 |
| Named for | Gideon C. Moody |
| Seat | Flandreau |
| Largest city | Flandreau |
| Area | |
| • Total | 521 sq mi (1,350 km2) |
| • Land | 519 sq mi (1,340 km2) |
| • Water | 1.4 sq mi (4 km2) 0.3% |
| Population (2010) | |
| • Total | 6,486 |
| • Estimate (2018) | 6,579 |
| • Density | 12/sq mi (4.8/km2) |
| Time zone | UTC−6 (Central) |
| • Summer (DST) | UTC−5 (CDT) |
| Congressional district | At-large |
| Website | www |
Geography
Moody County lies on the east side of South Dakota. Its east boundary line abuts the west boundary line of the state of Minnesota. The Big Sioux River flows southerly through the center of the county. Its terrain consists of rolling hills, devoted to agriculture, with lakes in the western portion.[4] The terrain slopes to the south, with its high point near its northeast corner, at 1,749' (533m) ASL, although the east and west sides also slope into the river valley through the center of the county.[5] The county has a total area of 521 square miles (1,350 km2), of which 519 square miles (1,340 km2) is land and 1.4 square miles (3.6 km2) (0.3%) is water.[6]
Major highways
Adjacent counties
- Brookings County - north
- Lincoln County, Minnesota - northeast
- Pipestone County, Minnesota - east
- Rock County, Minnesota - southeast
- Minnehaha County - south
- Lake County - west
Lakes[4]
- Anderson Slough
- Lake Campbell (part)
- Mud Lake
- Poison Lake
- Bull Slough
Protected areas[4]
- Anderson Slough State Game Production Area
- Boles Slough State Game Production Area
- Gideon State Game Production Area
- Hazels Haven State Game Production Area
- Kamp State Game Production Area
- Olson Lake State Game Production Area
Demographics
| Historical population | |||
|---|---|---|---|
| Census | Pop. | %± | |
| 1880 | 3,915 | — | |
| 1890 | 5,941 | 51.7% | |
| 1900 | 8,326 | 40.1% | |
| 1910 | 8,695 | 4.4% | |
| 1920 | 9,742 | 12.0% | |
| 1930 | 9,603 | −1.4% | |
| 1940 | 9,341 | −2.7% | |
| 1950 | 9,252 | −1.0% | |
| 1960 | 8,810 | −4.8% | |
| 1970 | 7,622 | −13.5% | |
| 1980 | 6,692 | −12.2% | |
| 1990 | 6,507 | −2.8% | |
| 2000 | 6,595 | 1.4% | |
| 2010 | 6,486 | −1.7% | |
| 2019 (est.) | 6,576 | [7] | 1.4% |
| US Decennial Census[8] 1790-1960[9] 1900-1990[10] 1990-2000[11] 2010-2018[1] | |||
2000 census
As of the 2000 United States Census,[12] there were 6,595 people, 2,526 households, and 1,763 families in the county. The population density was 13 people per square mile (5/km2). There were 2,745 housing units at an average density of 5 per square mile (2/km2). The racial makeup of the county was 84.91% White, 0.29% Black or African American, 12.01% Native American, 0.56% Asian, 0.06% from other races, and 2.17% from two or more races. 0.76% of the population were Hispanic or Latino of any race.
There were 2,526 households, out of which 35.60% had children under the age of 18 living with them, 56.70% were married couples living together, 8.50% had a female householder with no husband present, and 30.20% were non-families. 26.40% of all households were made up of individuals, and 12.20% had someone living alone who was 65 years of age or older. The average household size was 2.58 and the average family size was 3.12.
The county population contained 29.10% under the age of 18, 7.20% from 18 to 24, 26.40% from 25 to 44, 22.30% from 45 to 64, and 14.90% who were 65 years of age or older. The median age was 37 years. For every 100 females there were 99.80 males. For every 100 females age 18 and over, there were 97.00 males.
The median income for a household in the county was $35,467, and the median income for a family was $41,623. Males had a median income of $27,391 versus $20,472 for females. The per capita income for the county was $16,541. About 7.30% of families and 9.60% of the population were below the poverty line, including 11.40% of those under age 18 and 10.90% of those age 65 or over.
2010 census
As of the 2010 United States Census, there were 6,486 people, 2,554 households, and 1,751 families in the county.[13] The population density was 12.5 inhabitants per square mile (4.8/km2). There were 2,824 housing units at an average density of 5.4 per square mile (2.1/km2).[14] The racial makeup of the county was 81.0% white, 14.0% American Indian, 1.1% Asian, 0.5% black or African American, 0.7% from other races, and 2.7% from two or more races. Those of Hispanic or Latino origin made up 1.7% of the population.[13] In terms of ancestry, 39.9% were German, 20.1% were Norwegian, 8.9% were Irish, 6.1% were Dutch, 5.1% were English, and 1.6% were American.[15]
Of the 2,554 households, 30.9% had children under the age of 18 living with them, 54.3% were married couples living together, 8.8% had a female householder with no husband present, 31.4% were non-families, and 27.4% of all households were made up of individuals. The average household size was 2.48 and the average family size was 3.00. The median age was 40.5 years.[13]
The median income for a household in the county was $52,354 and the median income for a family was $61,667. Males had a median income of $36,364 versus $30,854 for females. The per capita income for the county was $24,948. About 4.7% of families and 7.1% of the population were below the poverty line, including 8.8% of those under age 18 and 13.1% of those age 65 or over.[16]
Communities
Unincorporated community
- Lone Tree
Townships
- Alliance
- Blinsmon
- Clare
- Colman
- Egan
- Enterprise
- Flandreau
- Fremont
- Grovena
- Jefferson
- Lone Rock
- Lynn
- Riverview
- Spring Creek
- Union
- Ward
Politics
Moody County voters tend to split between the two major political parties. Since 1960, the national election results in Moody County have been evenly split between Republican and Democratic Party candidates (as of 2016).
| Year | Republican | Democratic | Third parties |
|---|---|---|---|
| 2020 | 60.8% 1,951 | 36.8% 1,179 | 2.4% 76 |
| 2016 | 59.0% 1,731 | 35.6% 1,043 | 5.4% 159 |
| 2012 | 50.6% 1,535 | 47.1% 1,429 | 2.3% 69 |
| 2008 | 46.3% 1,508 | 51.1% 1,663 | 2.6% 83 |
| 2004 | 51.9% 1,790 | 46.6% 1,609 | 1.5% 52 |
| 2000 | 49.8% 1,361 | 48.2% 1,318 | 2.1% 56 |
| 1996 | 37.0% 1,024 | 52.2% 1,443 | 10.8% 300 |
| 1992 | 28.9% 898 | 47.5% 1,473 | 23.6% 733 |
| 1988 | 40.2% 1,161 | 59.4% 1,715 | 0.5% 13 |
| 1984 | 50.6% 1,633 | 49.1% 1,586 | 0.3% 9 |
| 1980 | 51.9% 1,807 | 39.2% 1,364 | 8.9% 309 |
| 1976 | 43.0% 1,475 | 56.7% 1,942 | 0.3% 11 |
| 1972 | 46.4% 1,648 | 53.3% 1,895 | 0.3% 11 |
| 1968 | 48.9% 1,689 | 46.7% 1,614 | 4.4% 153 |
| 1964 | 38.8% 1,461 | 61.2% 2,301 | |
| 1960 | 52.5% 2,119 | 47.5% 1,918 | |
| 1956 | 53.7% 2,133 | 46.3% 1,840 | |
| 1952 | 71.5% 2,728 | 28.5% 1,089 | |
| 1948 | 50.2% 1,691 | 48.4% 1,630 | 1.4% 48 |
| 1944 | 59.4% 2,080 | 40.6% 1,420 | |
| 1940 | 60.2% 2,749 | 39.8% 1,820 | |
| 1936 | 43.7% 1,992 | 51.9% 2,366 | 4.4% 202 |
| 1932 | 33.0% 1,289 | 65.2% 2,547 | 1.8% 70 |
| 1928 | 59.6% 2,108 | 40.1% 1,416 | 0.3% 11 |
| 1924 | 41.7% 1,181 | 8.3% 234 | 50.1% 1,418 |
| 1920 | 63.6% 1,667 | 14.1% 371 | 22.3% 585 |
| 1916 | 49.1% 973 | 45.3% 898 | 5.6% 111 |
| 1912 | 0.0% 0 | 35.6% 637 | 64.4% 1,152 |
| 1908 | 63.5% 1,275 | 31.0% 623 | 5.5% 110 |
| 1904 | 75.1% 1,471 | 15.1% 295 | 9.8% 192 |
| 1900 | 56.9% 1,190 | 41.9% 875 | 1.2% 26 |
| 1896 | 43.4% 780 | 56.3% 1,012 | 0.4% 7 |
| 1892 | 53.3% 735 | 7.0% 96 | 39.7% 548 |
References
- "State & County QuickFacts". United States Census Bureau. Archived from the original on June 7, 2011. Retrieved November 25, 2013.
- "Find a County". National Association of Counties. Retrieved June 7, 2011.
- Homepage at MoodyCounty.net; published 2011; retrieved January 9, 2014
- Moody County SD Google Maps (accessed February 7, 2019)
- ""Find an Altitude" Google Maps (accessed February 7, 2019)". Archived from the original on May 21, 2019. Retrieved February 8, 2019.
- "2010 Census Gazetteer Files". US Census Bureau. August 22, 2012. Retrieved March 28, 2015.
- "Annual Estimates of the Resident Population for Counties: April 1, 2010 to July 1, 2019". Retrieved April 10, 2020.
- "US Decennial Census". US Census Bureau. Retrieved March 28, 2015.
- "Historical Census Browser". University of Virginia Library. Retrieved March 28, 2015.
- Forstall, Richard L., ed. (March 27, 1995). "Population of Counties by Decennial Census: 1900 to 1990". US Census Bureau. Retrieved March 28, 2015.
- "Census 2000 PHC-T-4. Ranking Tables for Counties: 1990 and 2000" (PDF). US Census Bureau. April 2, 2001. Retrieved March 28, 2015.
- "U.S. Census website". US Census Bureau]]. Retrieved May 14, 2011.
- "Profile of General Population and Housing Characteristics: 2010 Demographic Profile Data". US Census Bureau. Archived from the original on February 13, 2020. Retrieved March 12, 2016.
- "Population, Housing Units, Area, and Density: 2010 - County". US Census Bureau. Archived from the original on February 13, 2020. Retrieved March 12, 2016.
- "Selected Social Characteristics in the US – 2006-2010 American Community Survey 5-Year Estimates". US Census Bureau. Archived from the original on February 13, 2020. Retrieved March 12, 2016.
- "Selected Economic Characteristics – 2006-2010 American Community Survey 5-Year Estimates". US Census Bureau. Archived from the original on February 13, 2020. Retrieved March 12, 2016.
- Leip, David. "Atlas of US Presidential Elections". uselectionatlas.org. Retrieved April 15, 2018.
Places adjacent to Moody County, South Dakota | ||||||||||
|---|---|---|---|---|---|---|---|---|---|---|
| ||||||||||
Municipalities and communities of Moody County, South Dakota, United States | ||
|---|---|---|
| Cities | | |
| Towns | ||
| Indian reservations | ||
| ||

| Authority control |
|---|