Spink County, South Dakota
Spink County is a county in the U.S. state of South Dakota. As of the 2010 census, the population was 6,415.[1] Its county seat is Redfield.[2] The county was created in 1873, and was organized in 1879 within Dakota Territory.[3]
Spink County | |
|---|---|
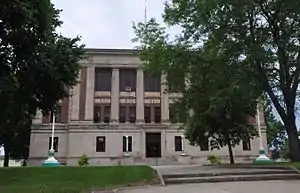 Spink County Courthouse (2013) | |
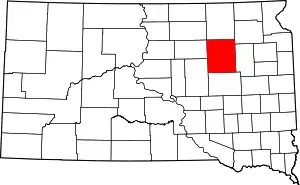 Location within the U.S. state of South Dakota | |
 South Dakota's location within the U.S. | |
| Coordinates: 44°56′N 98°21′W | |
| Country | |
| State | |
| Founded | 1873 (created) 1879 (organized) |
| Named for | S.L. Spink |
| Seat | Redfield |
| Largest city | Redfield |
| Area | |
| • Total | 1,510 sq mi (3,900 km2) |
| • Land | 1,504 sq mi (3,900 km2) |
| • Water | 5.8 sq mi (15 km2) 0.4% |
| Population (2010) | |
| • Total | 6,415 |
| • Estimate (2018) | 6,495 |
| • Density | 4.2/sq mi (1.6/km2) |
| Time zone | UTC−6 (Central) |
| • Summer (DST) | UTC−5 (CDT) |
| Congressional district | At-large |
| Website | www |
Geography
The terrain of Spink County consists of rolling hills, dedicated to agriculture. The James River flows southerly through the central portion of the county.[4] The terrain slopes to the south; its highest point is in its northeast corner, at 1,424' (434m) ASL.[5] The county has a total area of 1,510 square miles (3,900 km2), of which 1,504 square miles (3,900 km2) is land and 5.8 square miles (15 km2) (0.4%) is water.[6]
Major highways
Protected area
Adjacent counties
- Brown County - north
- Day County - northeast
- Clark County - east
- Beadle County - south
- Hand County - southwest
- Faulk County - west
Lakes[4]
- Alkali Lake
- Cottonwood Lake
- Twin Lakes
Demographics
| Historical population | |||
|---|---|---|---|
| Census | Pop. | %± | |
| 1880 | 477 | — | |
| 1890 | 10,581 | 2,118.2% | |
| 1900 | 9,487 | −10.3% | |
| 1910 | 15,981 | 68.5% | |
| 1920 | 15,768 | −1.3% | |
| 1930 | 15,304 | −2.9% | |
| 1940 | 12,527 | −18.1% | |
| 1950 | 12,204 | −2.6% | |
| 1960 | 11,706 | −4.1% | |
| 1970 | 10,595 | −9.5% | |
| 1980 | 9,201 | −13.2% | |
| 1990 | 7,981 | −13.3% | |
| 2000 | 7,454 | −6.6% | |
| 2010 | 6,415 | −13.9% | |
| 2019 (est.) | 6,376 | [7] | −0.6% |
| US Decennial Census[8] 1790-1960[9] 1900-1990[10] 1990-2000[11] 2010-2018[1] | |||
2000 census
As of the 2000 United States Census,[12] there were 7,454 people, 2,847 households, and 1,933 families in the county. The population density was 5 people per square mile (2/km2). There were 3,352 housing units at an average density of 2 per square mile (1/km2). The racial makeup of the county was 97.56% White, 0.21% Black or African American, 1.48% Native American, 0.09% Asian, 0.01% Pacific Islander, 0.12% from other races, and 0.52% from two or more races. 0.39% of the population were Hispanic or Latino of any race.
There were 2,847 households, out of which 30.60% had children under the age of 18 living with them, 58.60% were married couples living together, 6.10% had a female householder with no husband present, and 32.10% were non-families. 29.30% of all households were made up of individuals, and 15.80% had someone living alone who was 65 years of age or older. The average household size was 2.45 and the average family size was 3.05.
The county population contained 25.60% under the age of 18, 6.70% from 18 to 24, 26.10% from 25 to 44, 22.60% from 45 to 64, and 18.90% who were 65 years of age or older. The median age was 40 years. For every 100 females there were 107.20 males. For every 100 females age 18 and over, there were 106.20 males.
The median income for a household in the county was $31,717, and the median income for a family was $37,114. Males had a median income of $25,065 versus $20,386 for females. The per capita income for the county was $15,728. About 10.20% of families and 12.80% of the population were below the poverty line, including 17.20% of those under age 18 and 9.80% of those age 65 or over.
Several Hutterite communities are in Spink County, including near Ashton and Stratford.[13]
2010 census
As of the 2010 United States Census, there were 6,415 people, 2,608 households, and 1,677 families in the county.[14] The population density was 4.3 inhabitants per square mile (1.7/km2). There were 3,139 housing units at an average density of 2.1 per square mile (0.81/km2).[15] The racial makeup of the county was 97.1% white, 1.2% American Indian, 0.3% black or African American, 0.1% Asian, 0.4% from other races, and 0.9% from two or more races. Those of Hispanic or Latino origin made up 1.1% of the population.[14] In terms of ancestry, 52.6% were German, 11.6% were Norwegian, 10.0% were Irish, 9.2% were English, and 5.5% were American.[16]
Of the 2,608 households, 26.5% had children under the age of 18 living with them, 53.4% were married couples living together, 6.4% had a female householder with no husband present, 35.7% were non-families, and 31.8% of all households were made up of individuals. The average household size was 2.30 and the average family size was 2.89. The median age was 44.4 years.[14]
The median income for a household in the county was $45,000 and the median income for a family was $60,639. Males had a median income of $40,273 versus $26,139 for females. The per capita income for the county was $25,295. About 8.2% of families and 17.0% of the population were below the poverty line, including 19.0% of those under age 18 and 12.0% of those age 65 or over.[17]
Communities
Towns
Census-designated place
- Mansfield (partial)
Townships
- Antelope
- Athol
- Belle Plaine
- Belmont
- Benton
- Beotia
- Buffalo
- Capitola
- Clifton
- Conde
- Cornwall
- Crandon
- Exline
- Frankfort
- Garfield
- Great Bend
- Groveland
- Harmony
- Harrison
- Jefferson
- Lake
- La Prairie
- Lincoln
- Lodi
- Mellette
- Northville
- Olean
- Prairie Center
- Redfield
- Richfield
- Spring
- Sumner
- Tetonka
- Three Rivers
- Tulare
- Turton
- Union
Politics
Spink County was historically a swing county, but in the past few decades has become fairly Republican. In no national election since 1992 has the county selected the Democratic Party candidate (as of 2016).
| Year | Republican | Democratic | Third parties |
|---|---|---|---|
| 2016 | 62.8% 1,854 | 31.1% 919 | 6.0% 178 |
| 2012 | 54.9% 1,670 | 42.8% 1,300 | 2.3% 71 |
| 2008 | 50.8% 1,660 | 47.4% 1,550 | 1.8% 59 |
| 2004 | 59.9% 2,259 | 39.2% 1,478 | 1.0% 37 |
| 2000 | 59.6% 1,957 | 38.8% 1,274 | 1.6% 53 |
| 1996 | 45.0% 1,651 | 44.6% 1,636 | 10.4% 382 |
| 1992 | 37.1% 1,527 | 42.1% 1,732 | 20.7% 853 |
| 1988 | 48.5% 1,969 | 51.0% 2,071 | 0.5% 22 |
| 1984 | 60.8% 2,627 | 38.9% 1,680 | 0.4% 17 |
| 1980 | 60.3% 2,915 | 32.5% 1,572 | 7.2% 347 |
| 1976 | 42.8% 2,003 | 56.6% 2,650 | 0.6% 26 |
| 1972 | 52.2% 2,547 | 47.6% 2,321 | 0.3% 12 |
| 1968 | 42.1% 2,068 | 54.3% 2,669 | 3.6% 178 |
| 1964 | 38.5% 1,953 | 61.5% 3,120 | |
| 1960 | 51.7% 2,738 | 48.4% 2,563 | |
| 1956 | 48.3% 2,683 | 51.7% 2,873 | |
| 1952 | 65.1% 3,693 | 34.9% 1,983 | |
| 1948 | 45.6% 2,310 | 53.3% 2,702 | 1.1% 55 |
| 1944 | 50.9% 2,365 | 49.1% 2,285 | |
| 1940 | 48.7% 2,975 | 51.3% 3,134 | |
| 1936 | 35.4% 2,078 | 60.8% 3,569 | 3.8% 224 |
| 1932 | 36.7% 2,433 | 61.0% 4,046 | 2.4% 156 |
| 1928 | 60.9% 3,868 | 38.6% 2,451 | 0.5% 33 |
| 1924 | 57.8% 2,613 | 13.2% 595 | 29.0% 1,312 |
| 1920 | 65.1% 2,923 | 17.5% 785 | 17.4% 783 |
| 1916 | 48.6% 1,660 | 47.5% 1,622 | 3.9% 133 |
| 1912 | 0.0% 0 | 44.5% 1,347 | 55.5% 1,678 |
| 1908 | 59.0% 1,847 | 35.8% 1,121 | 5.2% 162 |
| 1904 | 74.5% 2,127 | 17.2% 492 | 8.2% 235 |
| 1900 | 56.4% 1,496 | 41.0% 1,087 | 2.6% 69 |
| 1896 | 51.3% 1,132 | 48.1% 1,061 | 0.6% 13 |
| 1892 | 53.0% 1,133 | 8.0% 171 | 39.0% 832 |
References
- "State & County QuickFacts". US Census Bureau. Retrieved November 28, 2013.
- "Find a County". National Association of Counties. Retrieved June 7, 2011.
- "Dakota Territory, South Dakota, and North Dakota: Individual County Chronologies". Dakota Territory Atlas of Historical County Boundaries. The Newberry Library. 2006. Retrieved March 31, 2015.
- Spink County SD Google Maps (accessed 8 February 2019)
- ""Find an Altitude" Google Maps (accessed 8 February 2019)". Archived from the original on May 21, 2019. Retrieved February 8, 2019.
- "2010 Census Gazetteer Files". US Census Bureau. August 22, 2012. Retrieved March 28, 2015.
- "Annual Estimates of the Resident Population for Counties: April 1, 2010 to July 1, 2019". Retrieved April 10, 2020.
- "US Decennial Census". US Census Bureau. Retrieved March 28, 2015.
- "Historical Census Browser". University of Virginia Library. Retrieved March 28, 2015.
- Forstall, Richard L., ed. (March 27, 1995). "Population of Counties by Decennial Census: 1900 to 1990". US Census Bureau. Retrieved March 28, 2015.
- "Census 2000 PHC-T-4. Ranking Tables for Counties: 1990 and 2000" (PDF). US Census Bureau. April 2, 2001. Retrieved March 28, 2015.
- "U.S. Census website". US Census Bureau. Retrieved May 14, 2011.
- "New Hutterite Community being Planned in Spink County". Rapid City Journal. Associated Press. July 8, 2015. Retrieved July 8, 2015.
- "Profile of General Population and Housing Characteristics: 2010 Demographic Profile Data". US Census Bureau. Archived from the original on February 13, 2020. Retrieved March 12, 2016.
- "Population, Housing Units, Area, and Density: 2010 - County". US Census Bureau. Archived from the original on February 13, 2020. Retrieved March 12, 2016.
- "Selected Social Characteristics in the US – 2006-2010 American Community Survey 5-Year Estimates". US Census Bureau. Archived from the original on February 13, 2020. Retrieved March 12, 2016.
- "Selected Economic Characteristics – 2006-2010 American Community Survey 5-Year Estimates". US Census Bureau. Archived from the original on February 13, 2020. Retrieved March 12, 2016.
- Leip, David. "Atlas of US Presidential Elections". uselectionatlas.org. Retrieved April 15, 2018.
Places adjacent to Spink County, South Dakota | ||||||||||
|---|---|---|---|---|---|---|---|---|---|---|
| ||||||||||
Municipalities and communities of Spink County, South Dakota, United States | ||
|---|---|---|
| Cities | | |
| Towns | ||
| Townships |
| |
| CDP | ||
| Unincorporated communities | ||
| Footnotes | ‡This populated place also has portions in an adjacent county or counties | |
| ||

| Authority control |
|---|