Brown County, South Dakota
Brown County is a county in the U.S. state of South Dakota. As of the 2010 United States Census, the population was 36,531,[2] making it the fourth-most populous county in South Dakota. Its county seat is Aberdeen.[3] The county is named for Alfred Brown, of Hutchinson County, South Dakota, a Dakota Territory legislator in 1879.[1][4]
Brown County | |
|---|---|
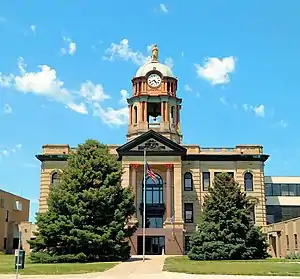 Brown County Courthouse in summer | |
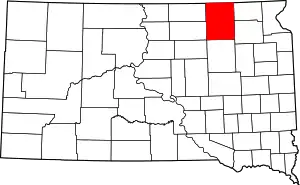 Location within the U.S. state of South Dakota | |
 South Dakota's location within the U.S. | |
| Coordinates: 45°36′N 98°21′W | |
| Country | |
| State | |
| Founded | July 6, 1881[1] |
| Seat | Aberdeen |
| Largest city | Aberdeen |
| Area | |
| • Total | 1,731 sq mi (4,480 km2) |
| • Land | 1,713 sq mi (4,440 km2) |
| • Water | 18 sq mi (50 km2) 1.0% |
| Population (2010) | |
| • Total | 36,531 |
| • Estimate (2018) | 39,316 |
| • Density | 21/sq mi (8.1/km2) |
| Time zone | UTC−6 (Central) |
| • Summer (DST) | UTC−5 (CDT) |
| Congressional district | At-large |
| Website | www |
Brown County is part of the Aberdeen, SD Micropolitan Statistical Area.
Geography
Brown County lies on the north side of South Dakota. Its north boundary line abuts the south boundary line of the state of North Dakota. The James River flows south-southwest through the county; its entry point into neighboring Spink County marks Brown County's lowest elevation: 1,266' (386m) ASL.[5] The terrain of Brown County consists of rolling terrain, sloping to the south and east, largely devoted to agriculture.[6]
The county has a total area of 1,731 square miles (4,480 km2), of which 1,713 square miles (4,440 km2) is land and 18 square miles (47 km2) (1.0%) is water.[7]
Major highways
 U.S. Highway 12
 U.S. Highway 281
 South Dakota Highway 10
 South Dakota Highway 37
Adjacent counties
- Dickey County, North Dakota - north
- Sargent County, North Dakota - northeast
- Marshall County - east
- Day County - southeast
- Spink County - south
- Faulk County - southwest
- Edmunds County - southwest
- McPherson County - northwest
Protected areas
- Bodi State Game Production Area (part)
- Casanova State Game Production Area
- Columbia Sttae Game Production Area
- Cutler State Game Production Area
- Diagonal Trees State Game Production Area
- Elm Creek State Game Production Area (part)
- Erickson State Game Production Area
- Hansen Preserve State Game Production Area
- Hart Quarter State Game Production Area
- Hecla State Game Production Area
- Jilek-Dahme State Game Production Area
- Pigors Lake State Game Production Area
- Putney Slough State Game Production Area
- Putney State Game Production Area
- Renziehausen Slough State Game Bird Refuge
- Renziehausen State Game Production Area (part)
- Richmond Dam State Game Production Area
- Richmond Lake State Recreation Area
- Richmond State Lakeside Use Area
- Sand Lake National Wildlife Refuge
- Zabrasha State Game Production Area
Demographics
| Historical population | |||
|---|---|---|---|
| Census | Pop. | %± | |
| 1880 | 353 | — | |
| 1890 | 16,855 | 4,674.8% | |
| 1900 | 15,286 | −9.3% | |
| 1910 | 25,867 | 69.2% | |
| 1920 | 29,509 | 14.1% | |
| 1930 | 31,458 | 6.6% | |
| 1940 | 29,676 | −5.7% | |
| 1950 | 32,617 | 9.9% | |
| 1960 | 34,106 | 4.6% | |
| 1970 | 36,920 | 8.3% | |
| 1980 | 36,962 | 0.1% | |
| 1990 | 35,580 | −3.7% | |
| 2000 | 35,460 | −0.3% | |
| 2010 | 36,531 | 3.0% | |
| 2019 (est.) | 38,839 | [8] | 6.3% |
| US Decennial Census[9] 1790-1960[10] 1900-1990[11] 1990-2000[12] 2010-2018[2] | |||
2000 census
As of the 2000 United States Census,[13] there were 35,460 people, 14,638 households, and 9,324 families in the county. The population density was 21 people per square mile (8/km2). There were 15,861 housing units at an average density of 9 per square mile (4/km2). The racial makeup of the county was 95.47% White, 0.28% Black or African American, 2.72% Native American, 0.40% Asian, 0.09% Pacific Islander, 0.18% from other races, and 0.86% from two or more races. 0.67% of the population were Hispanic or Latino of any race. 55.0% were of German and 12.7% of Norwegian ancestry.
There were 14,638 households, out of which 29.60% had children under the age of 18 living with them, 52.80% were married couples living together, 7.90% had a female householder with no husband present, and 36.30% were non-families. 30.80% of all households were made up of individuals, and 12.10% had someone living alone who was 65 years of age or older. The average household size was 2.32 and the average family size was 2.91.
The county population contained 23.60% under the age of 18, 11.60% from 18 to 24, 26.70% from 25 to 44, 21.90% from 45 to 64, and 16.20% who were 65 years of age or older. The median age was 37 years. For every 100 females, there were 93.30 males. For every 100 females age 18 and over, there were 89.50 males.
The median income for a household in the county was $35,017, and the median income for a family was $44,788. Males had a median income of $29,592 versus $20,445 for females. The per capita income for the county was $18,464. About 7.00% of families and 9.90% of the population were below the poverty line, including 10.30% of those under age 18 and 10.30% of those age 65 or over.
2010 census
As of the 2010 United States Census, there were 36,531 people, 15,489 households, and 9,374 families in the county.[14] The population density was 21.3 inhabitants per square mile (8.2/km2). There were 16,706 housing units at an average density of 9.8 per square mile (3.8/km2).[15] The racial makeup of the county was 93.2% white, 3.0% American Indian, 1.0% Asian, 0.5% black or African American, 0.1% Pacific islander, 0.4% from other races, and 1.7% from two or more races. Those of Hispanic or Latino origin made up 1.4% of the population.[14] In terms of ancestry,[16]
Of the 15,489 households, 28.4% had children under the age of 18 living with them, 48.5% were married couples living together, 8.1% had a female householder with no husband present, 39.5% were non-families, and 33.0% of all households were made up of individuals. The average household size was 2.27 and the average family size was 2.89. The median age was 38.6 years.[14]
The median income for a household in the county was $45,615 and the median income for a family was $58,683. Males had a median income of $37,997 versus $28,419 for females. The per capita income for the county was $23,878. About 5.6% of families and 10.2% of the population were below the poverty line, including 9.6% of those under age 18 and 15.4% of those age 65 or over.[17]
Politics
Brown County was long a Democratic stronghold, home to notable Democrats including South Dakota Governor Ralph Herseth, US Senate majority leader Tom Daschle and Congresswoman Stephanie Herseth Sandlin. It generally voted Democratic except in Republican landslides (though often relatively narrowly margins) in presidential elections from 1932 until 1996. Since then, Brown County has trended Republican, particularly at the local level, although the county was carried by Barack Obama in 2008.
| Year | Republican | Democratic | Third parties |
|---|---|---|---|
| 2016 | 59.7% 9,613 | 33.8% 5,452 | 6.5% 1,049 |
| 2012 | 51.8% 8,321 | 45.1% 7,250 | 3.1% 497 |
| 2008 | 46.3% 8,067 | 51.9% 9,041 | 1.8% 318 |
| 2004 | 55.8% 10,386 | 42.7% 7,943 | 1.5% 270 |
| 2000 | 54.7% 9,060 | 43.3% 7,173 | 2.0% 323 |
| 1996 | 41.4% 6,801 | 48.1% 7,913 | 10.5% 1,733 |
| 1992 | 36.9% 6,665 | 41.7% 7,521 | 21.4% 3,861 |
| 1988 | 49.3% 8,537 | 50.1% 8,673 | 0.5% 92 |
| 1984 | 60.4% 10,541 | 39.2% 6,852 | 0.4% 72 |
| 1980 | 58.6% 10,550 | 33.6% 6,050 | 7.8% 1,399 |
| 1976 | 45.8% 7,609 | 53.4% 8,888 | 0.8% 136 |
| 1972 | 49.4% 8,134 | 49.9% 8,216 | 0.6% 101 |
| 1968 | 46.0% 6,685 | 50.2% 7,302 | 3.9% 560 |
| 1964 | 37.8% 5,524 | 62.2% 9,107 | |
| 1960 | 50.5% 8,037 | 49.6% 7,893 | |
| 1956 | 53.3% 8,193 | 46.7% 7,184 | |
| 1952 | 60.9% 9,581 | 39.1% 6,140 | |
| 1948 | 43.4% 5,632 | 55.1% 7,148 | 1.5% 192 |
| 1944 | 46.9% 5,611 | 53.1% 6,352 | |
| 1940 | 45.1% 6,598 | 55.0% 8,048 | |
| 1936 | 32.2% 4,505 | 65.6% 9,177 | 2.2% 311 |
| 1932 | 34.1% 4,639 | 63.7% 8,669 | 2.2% 293 |
| 1928 | 58.0% 7,266 | 40.5% 5,065 | 1.5% 191 |
| 1924 | 60.7% 2,740 | 8.0% 361 | 31.3% 1,415 |
| 1920 | 56.5% 5,581 | 13.8% 1,364 | 29.6% 2,926 |
| 1916 | 45.2% 2,659 | 45.5% 2,676 | 9.3% 549 |
| 1912 | 0.0% 0 | 50.7% 2,488 | 49.3% 2,420 |
| 1908 | 55.9% 2,646 | 37.5% 1,772 | 6.6% 313 |
| 1904 | 66.3% 2,737 | 23.9% 988 | 9.7% 402 |
| 1900 | 54.4% 2,197 | 42.7% 1,722 | 2.9% 118 |
| 1896 | 46.2% 1,618 | 53.3% 1,867 | 0.6% 21 |
| 1892 | 45.3% 1,446 | 8.8% 279 | 45.9% 1,465 |
Communities
Census-designated places
- Bath
- Bath Corner
- Ferney
- Mansfield (partial)
Unincorporated communities
Townships
- Aberdeen
- Allison
- Bates
- Bath
- Barnard
- Cambria
- Carlisle
- Claremont
- Columbia
- East Hanson
- East Rondell
- Franklyn
- Frederick
- Garden Prairie
- Garland
- Gem
- Greenfield
- Groton
- Hecla
- Henry
- Highland
- Lansing
- Liberty
- Lincoln
- Mercier
- New Hope
- North Detroit
- Oneota
- Ordway
- Osceola
- Palmyra
- Portage
- Prairiewood
- Putney
- Ravinia
- Richland
- Riverside
- Savo
- Shelby
- South Detroit
- Warner
- West Hanson
- West
- Westport
External links
References
- Legislative Manual, South Dakota, 2005, p. 596
- "State & County QuickFacts". United States Census Bureau. Archived from the original on July 7, 2011. Retrieved November 26, 2013.
- "Find a County". National Association of Counties. Archived from the original on May 31, 2011. Retrieved June 7, 2011.
- History of the Origin of the Place Names in Nine Northwestern States. 1908. p. 12.
- ""Find an Altitude" Google Maps (accessed January 30, 2019)". Archived from the original on May 21, 2019. Retrieved January 31, 2019.
- Brown County SD Google Maps (accessed January 30, 2019)
- "2010 Census Gazetteer Files". US Census Bureau. August 22, 2012. Retrieved March 22, 2015.
- "Annual Estimates of the Resident Population for Counties: April 1, 2010 to July 1, 2019". Retrieved April 10, 2020.
- "US Decennial Census". US Census Bureau. Retrieved March 22, 2015.
- "Historical Census Browser". University of Virginia Library. Retrieved March 22, 2015.
- Forstall, Richard L., ed. (March 27, 1995). "Population of Counties by Decennial Census: 1900 to 1990". US Census Bureau. Retrieved March 22, 2015.
- "Census 2000 PHC-T-4. Ranking Tables for Counties: 1990 and 2000" (PDF). US Census Bureau. April 2, 2001. Retrieved March 22, 2015.
- "U.S. Census website". US Census Bureau. Retrieved May 14, 2011.
- "Profile of General Population and Housing Characteristics: 2010 Demographic Profile Data". US Census Bureau. Archived from the original on February 13, 2020. Retrieved March 11, 2016.
- "Population, Housing Units, Area, and Density: 2010 - County". US Census Bureau. Archived from the original on February 13, 2020. Retrieved March 11, 2016.
- "Selected Social Characteristics in the US – 2006-2010 American Community Survey 5-Year Estimates". US Census Bureau. Archived from the original on February 13, 2020. Retrieved March 11, 2016.
- "Selected Economic Characteristics – 2006-2010 American Community Survey 5-Year Estimates". US Census Bureau. Archived from the original on February 13, 2020. Retrieved March 11, 2016.
- Leip, David. "Dave Leip's Atlas of U.S. Presidential Elections". uselectionatlas.org. Retrieved 13 April 2018.
- James SD Google Maps (accessed 30 January 2019)
- Nahon SD Google Maps (accessed 30 January 2019)
- Richmond SD Google Maps (accessed 30 January 2019)
- Richmond Heights SD Google Maps (accessed 30 January 2019)
- Tacoma Park SD Google Maps (accessed 30 January 2019)
- Winship SD Google Maps (accessed January 30, 2019)
Places adjacent to Brown County, South Dakota | ||||||||||
|---|---|---|---|---|---|---|---|---|---|---|
| ||||||||||
Municipalities and communities of Brown County, South Dakota, United States | ||
|---|---|---|
| Cities | | |
| Towns | ||
| CDPs | ||
| Other unincorporated communities | ||
| Townships |
| |
| Footnotes | ‡This populated place also has portions in an adjacent county or counties | |
| ||

| Authority control |
|
|---|