Brule County, South Dakota
Brule County is a county in the U.S. state of South Dakota. As of the 2010 census, the population was 5,255.[1] Its county seat is Chamberlain.[2]
Brule County | |
|---|---|
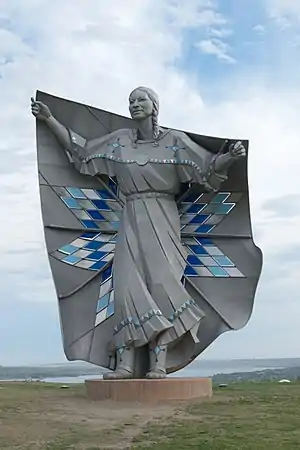 Statue of Dignity above the Missouri River, Chamberlain | |
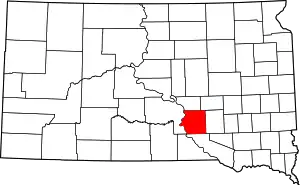 Location within the U.S. state of South Dakota | |
 South Dakota's location within the U.S. | |
| Coordinates: 43°43′N 99°04′W | |
| Country | |
| State | |
| Founded | 1875 (created) 1879 (organized) |
| Named for | Brulé subtribe of Lakota people |
| Seat | Chamberlain |
| Largest city | Chamberlain |
| Area | |
| • Total | 846 sq mi (2,190 km2) |
| • Land | 817 sq mi (2,120 km2) |
| • Water | 29 sq mi (80 km2) 3.5% |
| Population (2010) | |
| • Total | 5,255 |
| • Estimate (2018) | 5,229 |
| • Density | 6.2/sq mi (2.4/km2) |
| Time zone | UTC−6 (Central) |
| • Summer (DST) | UTC−5 (CDT) |
| Congressional district | At-large |
| Website | www |
History
Brule County was created on January 14, 1875, of territory partitioned from Charles Mix County. Its governing structure was also created at that time. However, in May 1875, Brule County was withdrawn from settlement, by order of US President Grant.[3] This order was later annulled, and the organization of Brule County governing structure was completed in September 1879.[4]
On March 9, 1883, the area of Brule County was slightly increased by an addition of former Buffalo County lands.[5] The total area of Brule County was further increased on June 4, 1891, when American Island (in the Missouri River)[6] was attached to the county (from the Sioux Reservation).[7] Its boundaries have remained unchanged since that date.
Geography
The Missouri River flows southward along the western boundary line of Brule County. The county terrain consists of rolling hills, partially dedicated to agriculture. The county has a total area of 846 square miles (2,190 km2), of which 817 square miles (2,120 km2) is land and 29 square miles (75 km2) (3.5%) is water.[8]
Major highways
Adjacent counties
- Buffalo County - north
- Jerauld County - northeast
- Aurora County - east
- Charles Mix County - south
- Lyman County - west
Protected areas
- Boyer State Game Production Area
- Brule Bottom State Game Production Area
- Burning Brule State Game Production Area
- Chain lake State Game Production Area
- Chamberlain State Game Production Area
- Elm Creek State Game Production Area
- Elm Creek State Lakeside Use Area
- Hoover State Game Production Area
- Kimball State Game Production Area
- Lake Sixteen State Game Production Area
Lakes
- Lake Francis Case (part)
- Red Lake
Demographics
| Historical population | |||
|---|---|---|---|
| Census | Pop. | %± | |
| 1880 | 238 | — | |
| 1890 | 6,737 | 2,730.7% | |
| 1900 | 5,401 | −19.8% | |
| 1910 | 6,451 | 19.4% | |
| 1920 | 7,141 | 10.7% | |
| 1930 | 7,416 | 3.9% | |
| 1940 | 6,195 | −16.5% | |
| 1950 | 6,076 | −1.9% | |
| 1960 | 6,319 | 4.0% | |
| 1970 | 5,870 | −7.1% | |
| 1980 | 5,245 | −10.6% | |
| 1990 | 5,485 | 4.6% | |
| 2000 | 5,364 | −2.2% | |
| 2010 | 5,255 | −2.0% | |
| 2019 (est.) | 5,297 | [9] | 0.8% |
| US Decennial Census[10] 1790-1960[11] 1900-1990[12] 1990-2000[13] 2010-2018[1] | |||
2000 census
As of the 2000 United States Census[14] there were 5,364 people, 1,998 households, and 1,328 families in the county. The population density was 6 people per square mile (3/km2). There were 2,272 housing units at an average density of 3 per square mile (1/km2). The racial makeup of the county was 89.91% White, 0.26% Black or African American, 8.28% Native American, 0.48% Asian, 0.02% Pacific Islander, 0.06% from other races, and 0.99% from two or more races. 0.48% of the population were Hispanic or Latino of any race. 39.6% were of German, 9.5% Czech, 8.6% Norwegian, 7.8% Irish and 6.6% United States or American ancestry.
There were 1,998 households, out of which 31.00% had children under the age of 18 living with them, 56.20% were married couples living together, 7.20% had a female householder with no husband present, and 33.50% were non-families. 29.90% of all households were made up of individuals, and 13.10% had someone living alone who was 65 years of age or older. The average household size was 2.49 and the average family size was 3.14.
The county population contained 30.50% under the age of 18, 6.80% from 18 to 24, 24.70% from 25 to 44, 21.20% from 45 to 64, and 16.90% who were 65 years of age or older. The median age was 37 years. For every 100 females there were 93.20 males. For every 100 females age 18 and over, there were 92.10 males.
The median income for a household in the county was $32,370, and the median income for a family was $37,361. Males had a median income of $26,698 versus $20,094 for females. The per capita income for the county was $14,874. About 8.10% of families and 14.30% of the population were below the poverty line, including 14.30% of those under age 18 and 20.20% of those age 65 or over.
2010 census
As of the 2010 United States Census, there were 5,255 people, 2,136 households, and 1,375 families in the county.[15] The population density was 6.4 inhabitants per square mile (2.5/km2). There were 2,433 housing units at an average density of 3.0 per square mile (1.2/km2).[16] The racial makeup of the county was 88.4% white, 8.5% American Indian, 0.2% black or African American, 0.2% Asian, 0.3% from other races, and 2.4% from two or more races. Those of Hispanic or Latino origin made up 1.4% of the population.[15] In terms of ancestry, 51.7% were German, 11.7% were Irish, 11.5% were Czech, 10.9% were Norwegian, 6.2% were English, and 1.3% were American.[17]
Of the 2,136 households, 30.3% had children under the age of 18 living with them, 52.0% were married couples living together, 8.6% had a female householder with no husband present, 35.6% were non-families, and 30.5% of all households were made up of individuals. The average household size was 2.40 and the average family size was 3.03. The median age was 41.3 years.[15]
The median income for a household in the county was $48,277 and the median income for a family was $58,363. Males had a median income of $33,958 versus $25,051 for females. The per capita income for the county was $19,779. About 9.8% of families and 9.1% of the population were below the poverty line, including 9.0% of those under age 18 and 10.6% of those age 65 or over.[18]
Communities
Cities
- Chamberlain (county seat)
- Kimball
Town
Census-designated places
Unincorporated community
- Grandview[19]
Townships
- America
- Brule
- Chamberlain
- Cleveland
- Eagle
- Highland
- Kimball
- Lyon
- Ola
- Plainfield
- Pleasant Grove
- Plummer
- Pukwana
- Red Lake
- Richland
- Smith
- Torrey Lake
- Waldro
- West Point
- Wilbur
- Willow Lake
- Union
Politics
For the first century of South Dakota statehood Brule County favoured the Democratic Party. It voted for a Republican Presidential candidate on just three occasions between 1896 and 1976 – and even in the landslides of Theodore Roosevelt, Harding and Eisenhower when each candidate swept every county in South Dakota, none of them obtained more than 53.1 percent of Brule County's vote. Richard Nixon, running against favorite son George McGovern in 1972, could not obtain 46 percent in Brule County while he was sweeping all but 129 other counties nationwide.
Since the “Reagan Revolution”, however, opposition common to all of rural white America to the Democratic Party's liberal views on social issues, along with perceived lack of economic opportunity, has made Brule strongly Republican. Michael Dukakis in 1988 was the last Democrat to win a majority in Brule County, although Bill Clinton twice obtained a plurality. Nonetheless, the anti-Democratic trend has been sufficiently strong that the past five Republican nominees have won over 58 percent of Brule County's vote, and Hillary Clinton’s 2016 performance is the worst by Democrat since Grover Cleveland during the county’s first presidential election.
| Year | Republican | Democratic | Third parties |
|---|---|---|---|
| 2020 | 70.3% 1,750 | 27.0% 673 | 2.7% 67 |
| 2016 | 68.4% 1,565 | 25.0% 571 | 6.6% 152 |
| 2012 | 63.0% 1,499 | 34.6% 824 | 2.4% 56 |
| 2008 | 57.7% 1,407 | 39.6% 965 | 2.8% 67 |
| 2004 | 58.7% 1,544 | 39.6% 1,040 | 1.7% 45 |
| 2000 | 58.5% 1,268 | 37.8% 818 | 3.7% 81 |
| 1996 | 40.8% 981 | 45.4% 1,091 | 13.8% 332 |
| 1992 | 33.9% 908 | 39.6% 1,060 | 26.5% 708 |
| 1988 | 49.2% 971 | 50.2% 991 | 0.6% 12 |
| 1984 | 61.7% 1,578 | 37.6% 961 | 0.7% 17 |
| 1980 | 59.8% 1,674 | 33.0% 925 | 7.2% 201 |
| 1976 | 43.2% 1,175 | 56.3% 1,534 | 0.5% 14 |
| 1972 | 45.9% 1,421 | 53.8% 1,665 | 0.4% 11 |
| 1968 | 43.9% 1,237 | 50.6% 1,425 | 5.4% 153 |
| 1964 | 30.5% 968 | 69.5% 2,205 | |
| 1960 | 46.7% 1,403 | 53.3% 1,600 | |
| 1956 | 41.0% 1,317 | 59.0% 1,894 | |
| 1952 | 53.1% 1,578 | 46.9% 1,392 | |
| 1948 | 38.5% 1,056 | 60.0% 1,646 | 1.5% 42 |
| 1944 | 41.5% 1,002 | 58.5% 1,412 | |
| 1940 | 42.4% 1,352 | 57.6% 1,835 | |
| 1936 | 29.6% 982 | 68.6% 2,274 | 1.8% 61 |
| 1932 | 24.0% 797 | 74.4% 2,465 | 1.6% 53 |
| 1928 | 46.5% 1,431 | 51.9% 1,599 | 1.6% 50 |
| 1924 | 37.1% 1,060 | 22.8% 650 | 40.1% 1,146 |
| 1920 | 51.0% 1,036 | 33.1% 671 | 15.9% 323 |
| 1916 | 41.7% 729 | 55.7% 975 | 2.6% 46 |
| 1912 | 53.6% 842 | 46.4% 728 | |
| 1908 | 46.8% 753 | 51.2% 823 | 2.1% 33 |
| 1904 | 51.6% 693 | 45.3% 608 | 3.1% 42 |
| 1900 | 47.1% 644 | 52.4% 716 | 0.4% 6 |
| 1896 | 39.6% 441 | 60.0% 668 | 0.5% 5 |
| 1892 | 44.0% 538 | 16.4% 200 | 39.6% 484 |
References
- "State & County QuickFacts". United States Census Bureau. Archived from the original on July 7, 2011. Retrieved November 26, 2013.
- "Find a County". National Association of Counties. Archived from the original on May 31, 2011. Retrieved June 7, 2011.
- Dakota Territory Laws 1874, 11th session, Chapter 31, p. 73
- "Dakota Territory, South Dakota, and North Dakota: Individual County Chronologies". Dakota Territory Atlas of Historical County Boundaries. The Newberry Library. 2006. Retrieved January 30, 2019.
- Dakota Territory Laws 1883, 15th session, chapter 14, p. 24
- "place" Brule County SD Google Maps (accessed 30 January 2019)
- South Dakota Laws 1891, 2nd session, chapter 45, p. 106
- "2010 Census Gazetteer Files". U.S. Census Bureau. August 22, 2012. Retrieved March 22, 2015.
- "Annual Estimates of the Resident Population for Counties: April 1, 2010 to July 1, 2019". Retrieved April 10, 2020.
- "US Decennial Census". US Census Bureau. Retrieved March 22, 2015.
- "Historical Census Browser". University of Virginia Library. Retrieved March 22, 2015.
- Forstall, Richard L., ed. (March 27, 1995). "Population of Counties by Decennial Census: 1900 to 1990". US Census Bureau. Retrieved March 22, 2015.
- "Census 2000 PHC-T-4. Ranking Tables for Counties: 1990 and 2000" (PDF). US Census Bureau. April 2, 2001. Retrieved March 22, 2015.
- "U.S. Census website". US Census Bureau. Retrieved May 14, 2011.
- "Profile of General Population and Housing Characteristics: 2010 Demographic Profile Data". U.S. Census Bureau. Archived from the original on February 13, 2020. Retrieved March 11, 2016.
- "Population, Housing Units, Area, and Density: 2010 - County". US Census Bureau. Archived from the original on 13 February 2020. Retrieved 11 March 2016.
- "Selected Social Characteristics in the US – 2006-2010 American Community Survey 5-Year Estimates". U.S. Census Bureau. Archived from the original on February 13, 2020. Retrieved March 11, 2016.
- "Selected Economic Characteristics – 2006-2010 American Community Survey 5-Year Estimates". US Census Bureau. Archived from the original on 13 February 2020. Retrieved 11 March 2016.
- Grandview SD Google Maps (accessed 30 January 2019)
- Leip, David. "Dave Leip's Atlas of U.S. Presidential Elections". uselectionatlas.org. Retrieved 2018-04-13.
Places adjacent to Brule County, South Dakota | ||||||||||
|---|---|---|---|---|---|---|---|---|---|---|
| ||||||||||
Municipalities and communities of Brule County, South Dakota, United States | ||
|---|---|---|
| Cities | | |
| Town | ||
| CDPs | ||
| Unincorporated community | ||
| Townships |
| |
| Unorganized Territory |
| |
| ||
