Faulk County, South Dakota
Faulk County is a county in the U.S. state of South Dakota. As of the 2010 census, the population was 2,364.[1] Its county seat is Faulkton.[2] The county was founded in 1873 and organized in 1883.[3] It is named for Andrew Jackson Faulk, the third Governor of Dakota Territory.[4]
Faulk County | |
|---|---|
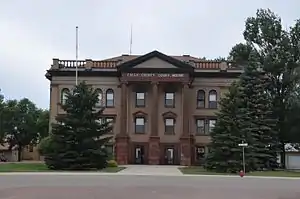 Faulk County Courthouse in July 2013 | |
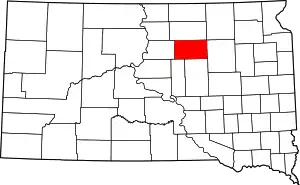 Location within the U.S. state of South Dakota | |
 South Dakota's location within the U.S. | |
| Coordinates: 45°04′N 99°09′W | |
| Country | |
| State | |
| Founded | 1873 (created) 1883 (organized) |
| Named for | Andrew Jackson Faulk |
| Seat | Faulkton |
| Largest city | Faulkton |
| Area | |
| • Total | 1,006 sq mi (2,610 km2) |
| • Land | 982 sq mi (2,540 km2) |
| • Water | 24 sq mi (60 km2) 2.4% |
| Population (2010) | |
| • Total | 2,010 |
| • Estimate (2018) | 2,330 |
| • Density | 2.0/sq mi (0.77/km2) |
| Time zone | UTC−6 (Central) |
| • Summer (DST) | UTC−5 (CDT) |
| Congressional district | At-large |
Geography
The terrain of Faulk County consists of low rolling hills, largely devoted to agriculture, sloping to the east. The highest point of the terrain is the county's SW corner, at 1,916' (584m) ASL.[5] The county has a total area of 1,006 square miles (2,610 km2), of which 982 square miles (2,540 km2) is land and 24 square miles (62 km2) (2.4%) is water.[6]
Major highways
Adjacent counties
- Edmunds County – north
- Brown County – northeast
- Spink County – east
- Hand County – south
- Hyde County – southwest
- Potter County – west
Protected areas
- Lake Faulkton State Game Refuge
- Ingalls State Game Production Area
- Gerkin State Game Production Area & Wildlife Refuge
- Lake Faulkton State Game Production Area
- Lake Faulkton State Lakeside Use Area
- North Scatterwood Lake State Waterfowl Refuge
- Sprague State Game Production Area
- South Scatterwood State Game Production Area
Lakes
- Clark Lake
- Lake Creabard
- Lake Faulkton
- North Scatterwood Lake (partial)
- South Scatterwood Lake
- Zell Lake
Demographics
| Historical population | |||
|---|---|---|---|
| Census | Pop. | %± | |
| 1880 | 4 | — | |
| 1890 | 4,062 | 101,450.0% | |
| 1900 | 3,547 | −12.7% | |
| 1910 | 6,716 | 89.3% | |
| 1920 | 6,442 | −4.1% | |
| 1930 | 6,895 | 7.0% | |
| 1940 | 5,168 | −25.0% | |
| 1950 | 4,752 | −8.0% | |
| 1960 | 4,397 | −7.5% | |
| 1970 | 3,893 | −11.5% | |
| 1980 | 3,327 | −14.5% | |
| 1990 | 2,744 | −17.5% | |
| 2000 | 2,640 | −3.8% | |
| 2010 | 2,364 | −10.5% | |
| 2019 (est.) | 2,299 | [7] | −2.7% |
| US Decennial Census[8] 1790-1960[9] 1900-1990[10] 1990-2000[11] 2010-2018[1] | |||
2000 census
As of the 2000 United States Census,[12] there were 2,640 people, 1,014 households, and 708 families in the county. The population density was 3 people per square mile (1/km2). There were 1,235 housing units at an average density of 1.3 per square mile (0.5/km2). The racial makeup of the county was 99.47% White, 0.08% Black or African American, 0.15% Native American, 0.04% Asian, and 0.27% from two or more races. 0.23% of the population were Hispanic or Latino of any race. 65.0% were of German, 6.2% American and 5.2% Norwegian ancestry.
There were 1,014 households, out of which 28.90% had children under the age of 18 living with them, 63.40% were married couples living together, 3.40% had a female householder with no husband present, and 30.10% were non-families. 29.10% of all households were made up of individuals, and 16.30% had someone living alone who was 65 years of age or older. The average household size was 2.56 and the average family size was 3.18.
The county population contained 26.60% under the age of 18, 5.40% from 18 to 24, 23.10% from 25 to 44, 22.00% from 45 to 64, and 22.90% who were 65 years of age or older. The median age was 42 years. For every 100 females there were 99.80 males. For every 100 females age 18 and over, there were 97.70 males.
The median income for a household in the county was $30,237, and the median income for a family was $34,508. Males had a median income of $25,085 versus $16,346 for females. The per capita income for the county was $14,660. About 12.60% of families and 18.10% of the population were below the poverty line, including 24.60% of those under age 18 and 7.80% of those age 65 or over.
2010 census
As of the 2010 United States Census, there were 2,364 people, 869 households, and 532 families in the county.[13] The population density was 2.4 inhabitants per square mile (0.93/km2). There were 1,136 housing units at an average density of 1.2 per square mile (0.46/km2).[14] The racial makeup of the county was 98.9% white, 0.1% Asian, 0.1% American Indian, 0.1% black or African American, 0.0% from other races, and 0.7% from two or more races. Those of Hispanic or Latino origin made up 0.8% of the population.[13] In terms of ancestry, 70.0% were German, 9.6% were Irish, 7.1% were English, 5.7% were Norwegian, and 4.3% were American.[15]
Of the 869 households, 20.6% had children under the age of 18 living with them, 54.9% were married couples living together, 4.1% had a female householder with no husband present, 38.8% were non-families, and 36.1% of all households were made up of individuals. The average household size was 2.15 and the average family size was 2.79. The median age was 46.9 years.[13]
The median income for a household in the county was $38,203 and the median income for a family was $55,234. Males had a median income of $40,641 versus $23,571 for females. The per capita income for the county was $21,898. About 14.4% of families and 17.9% of the population were below the poverty line, including 15.3% of those under age 18 and 14.3% of those age 65 or over.[16]
Communities
City
- Faulkton (county seat)
Townships
- Arcade
- Bryant
- Centerville
- Clark
- Devoe
- Ellisville
- Elroy
- Emerson
- Enterprise
- Fairview
- Freedom
- Hillsdale
- Irving
- Lafoon
- Latham
- Myron
- O'Neil
- Orient
- Pioneer
- Pulaski
- Saratoga
- Seneca
- Sherman
- Tamworth
- Thirteen
- Union
- Wesley
- Zell
Politics
Faulk County voters have largely voted Republican for several decades. In only two national elections since 1944 has the county selected the Democratic Party candidate (as of 2016).
| Year | Republican | Democratic | Third parties |
|---|---|---|---|
| 2020 | 81.6% 964 | 16.8% 198 | 1.7% 20 |
| 2016 | 76.7% 858 | 18.3% 204 | 5.0% 56 |
| 2012 | 67.9% 765 | 29.4% 331 | 2.8% 31 |
| 2008 | 62.0% 739 | 35.7% 426 | 2.3% 27 |
| 2004 | 69.0% 945 | 30.5% 418 | 0.4% 6 |
| 2000 | 68.0% 904 | 29.2% 388 | 2.8% 37 |
| 1996 | 52.3% 726 | 35.5% 493 | 12.2% 170 |
| 1992 | 45.9% 658 | 34.0% 488 | 20.1% 288 |
| 1988 | 53.9% 842 | 45.7% 714 | 0.3% 5 |
| 1984 | 65.9% 1,124 | 33.9% 579 | 0.2% 3 |
| 1980 | 66.8% 1,300 | 26.7% 520 | 6.4% 125 |
| 1976 | 44.8% 868 | 54.9% 1,063 | 0.3% 6 |
| 1972 | 50.1% 1,004 | 49.2% 986 | 0.8% 15 |
| 1968 | 49.5% 997 | 40.7% 819 | 9.9% 199 |
| 1964 | 44.3% 974 | 55.7% 1,225 | |
| 1960 | 54.3% 1,240 | 45.7% 1,043 | |
| 1956 | 52.2% 1,260 | 47.8% 1,155 | |
| 1952 | 68.7% 1,619 | 31.3% 738 | |
| 1948 | 51.5% 1,054 | 47.4% 971 | 1.1% 22 |
| 1944 | 54.9% 1,090 | 45.1% 896 | |
| 1940 | 54.4% 1,431 | 45.6% 1,199 | |
| 1936 | 43.5% 1,111 | 55.0% 1,404 | 1.6% 40 |
| 1932 | 38.9% 1,141 | 59.5% 1,743 | 1.6% 46 |
| 1928 | 62.5% 1,907 | 37.2% 1,135 | 0.4% 11 |
| 1924 | 56.1% 1,112 | 14.0% 277 | 30.0% 594 |
| 1920 | 65.5% 1,341 | 16.9% 346 | 17.6% 360 |
| 1916 | 52.9% 759 | 43.8% 629 | 3.3% 47 |
| 1912 | 0.0% 0 | 47.4% 615 | 52.6% 683 |
| 1908 | 62.6% 835 | 31.5% 421 | 5.9% 79 |
| 1904 | 75.4% 727 | 17.1% 165 | 7.5% 72 |
| 1900 | 65.1% 618 | 31.8% 302 | 3.2% 30 |
| 1896 | 64.1% 430 | 35.3% 237 | 0.6% 4 |
| 1892 | 63.8% 473 | 14.4% 107 | 21.8% 162 |
References
- "State & County QuickFacts". United States Census Bureau. Archived from the original on June 7, 2011. Retrieved November 25, 2013.
- "Find a County". National Association of Counties. Archived from the original on May 31, 2011. Retrieved June 7, 2011.
- "Dakota Territory, South Dakota, and North Dakota: Individual County Chronologies". Dakota Territory Atlas of Historical County Boundaries. The Newberry Library. 2006. Retrieved March 29, 2015.
- Gannett, Henry (1905). The Origin of Certain Place Names in the United States. Govt. Print. Off. p. 124.
- ""Find at Altitude" Google Maps (accessed 2 February 2019)". Archived from the original on 21 May 2019. Retrieved 3 February 2019.
- "2010 Census Gazetteer Files". US Census Bureau. August 22, 2012. Retrieved March 24, 2015.
- "Annual Estimates of the Resident Population for Counties: April 1, 2010 to July 1, 2019". Retrieved April 10, 2020.
- "US Decennial Census". US Census Bureau. Retrieved March 24, 2015.
- "Historical Census Browser". University of Virginia Library. Retrieved March 24, 2015.
- Forstall, Richard L., ed. (March 27, 1995). "Population of Counties by Decennial Census: 1900 to 1990". US Census Bureau. Retrieved March 24, 2015.
- "Census 2000 PHC-T-4. Ranking Tables for Counties: 1990 and 2000" (PDF). US Census Bureau. April 2, 2001. Retrieved March 24, 2015.
- "U.S. Census website". US Census Bureau. Retrieved 14 May 2011.
- "Profile of General Population and Housing Characteristics: 2010 Demographic Profile Data". US Census Bureau. Archived from the original on 13 February 2020. Retrieved 11 March 2016.
- "Population, Housing Units, Area, and Density: 2010 - County". US Census Bureau. Archived from the original on 13 February 2020. Retrieved 11 March 2016.
- "Selected Social Characteristics in the US – 2006-2010 American Community Survey 5-Year Estimates". US Census Bureau. Archived from the original on 13 February 2020. Retrieved 11 March 2016.
- "Selected Economic Characteristics – 2006-2010 American Community Survey 5-Year Estimates". US Census Bureau. Archived from the original on 13 February 2020. Retrieved 11 March 2016.
- Leip, David. "Atlas of US Presidential Elections". uselectionatlas.org. Retrieved 15 April 2018.
Places adjacent to Faulk County, South Dakota | ||||||||||
|---|---|---|---|---|---|---|---|---|---|---|
| ||||||||||
Municipalities and communities of Faulk County, South Dakota, United States | ||
|---|---|---|
| City | | |
| Towns | ||
| Unincorporated communities | ||
| ||
