Union County, South Dakota
Union County is a county in the U.S. state of South Dakota. As of the 2010 United States Census, the population was 14,399.[1] Its county seat is Elk Point.[2] Originally named Cole County, its name was changed to Union because of Civil War sentiment.
Union County | |
|---|---|
 | |
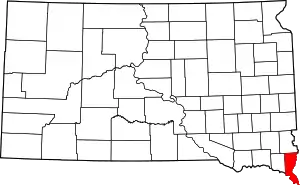 Location within the U.S. state of South Dakota | |
 South Dakota's location within the U.S. | |
| Coordinates: 42°50′N 96°39′W | |
| Country | |
| State | |
| Founded | April 10, 1862 |
| Seat | Elk Point |
| Largest city | North Sioux City |
| Area | |
| • Total | 467 sq mi (1,210 km2) |
| • Land | 461 sq mi (1,190 km2) |
| • Water | 6.6 sq mi (17 km2) 1.4% |
| Population (2010) | |
| • Total | 14,399 |
| • Estimate (2018) | 15,619 |
| • Density | 31/sq mi (12/km2) |
| Time zone | UTC−6 (Central) |
| • Summer (DST) | UTC−5 (CDT) |
| Congressional district | At-large |
| Website | unioncountysd |
Union County is part of the Sioux City, IA–NE–SD Metropolitan Statistical Area. Progressive Farmer rated Union County second in the "2006 Best Place to Live Survey" in the U.S., because "its schools are good, its towns neat and its people friendly."
Geography
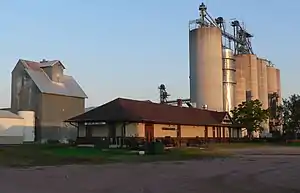
Union County lies on the southeast corner of South Dakota. Its east boundary line abuts the west boundary line of the state of Iowa (across the Big Sioux River), and its south/southwest boundary line abuts the north boundary line of the state of Nebraska (across the Missouri River). The Brule Creek flows southeasterly across the central part of the county, emptying into the Big Sioux. The county terrain consists of rolling hills, devoted to agriculture except around built-up areas.[3] The terrain slopes to the south and east; its highest point is near its northwest corner, at 1,509' (460m) ASL.[4] The county has a total area of 467 square miles (1,210 km2), of which 461 square miles (1,190 km2) is land and 6.6 square miles (17 km2) (1.4%) is water.[5] It is the fifth-smallest county in South Dakota by area.
Major highways
Adjacent counties
- Lincoln County - north
- Sioux County, Iowa - northeast
- Plymouth County, Iowa - east
- Woodbury County, Iowa - southeast
- Dakota County, Nebraska - south
- Dixon County, Nebraska - southwest
- Clay County - west
State protected areas[3]
- Adams Homestead & State Nature Park
- Lewis & Clark Campsite/Heritage Park (Elk Point)
- Missouri National Recreational River (partial)
- Union Grove State Park
Lakes[3]
- Burbank Lake (partial)
- McCook Lake
- Mud Lake
Demographics
| Historical population | |||
|---|---|---|---|
| Census | Pop. | %± | |
| 1870 | 3,507 | — | |
| 1880 | 6,813 | 94.3% | |
| 1890 | 9,130 | 34.0% | |
| 1900 | 11,153 | 22.2% | |
| 1910 | 10,676 | −4.3% | |
| 1920 | 11,099 | 4.0% | |
| 1930 | 11,480 | 3.4% | |
| 1940 | 11,675 | 1.7% | |
| 1950 | 10,792 | −7.6% | |
| 1960 | 10,197 | −5.5% | |
| 1970 | 9,643 | −5.4% | |
| 1980 | 10,938 | 13.4% | |
| 1990 | 10,189 | −6.8% | |
| 2000 | 12,584 | 23.5% | |
| 2010 | 14,399 | 14.4% | |
| 2019 (est.) | 15,932 | [6] | 10.6% |
| US Decennial Census[7] 1790-1960[8] 1900-1990[9] 1990-2000[10] 2010-2018[1] | |||
2000 census
As of the 2000 United States Census,[11] there were 12,584 people, 4,927 households, and 3,517 families in the county. The population density was 27 people per square mile (11/km2). There were 5,345 housing units at an average density of 12 per square mile (4/km2). The racial makeup of the county was 96.85% White, 1.34% Asian, 0.37% Native American, 0.01% Pacific Islander, 0.33% Black or African American, 0.24% from other races, and 0.87% from two or more races. 1.26% of the population were Hispanic or Latino of any race.
There were 4,927 households, out of which 34.80% had children under the age of 18 living with them, 62.00% were married couples living together, 6.30% had a female householder with no husband present, and 28.60% were non-families. 24.20% of all households were made up of individuals, and 10.30% had someone living alone who was 65 years of age or older. The average household size was 2.53 and the average family size was 3.02.
The county population contained 27.00% under the age of 18, 7.30% from 18 to 24, 28.40% from 25 to 44, 23.70% from 45 to 64, and 13.50% who were 65 years of age or older. The median age was 37 years. For every 100 females, there were 99.20 males. For every 100 females age 18 and over, there were 98.30 males.
The median income for a household in the county was $44,790, and the median income for a family was $51,227. Males had a median income of $35,406 versus $23,440 for females. The per capita income for the county was $24,355. About 3.70% of families and 5.50% of the population were below the poverty line, including 4.90% of those under age 18 and 10.70% of those age 65 or over.
2010 census
As of the 2010 United States Census, there were 14,399 people, 5,756 households, and 4,043 families in the county.[12] The population density was 31.3 inhabitants per square mile (12.1/km2). There were 6,280 housing units at an average density of 13.6 per square mile (5.3/km2).[13] The racial makeup of the county was 95.5% white, 0.9% Asian, 0.7% black or African American, 0.6% American Indian, 0.1% Pacific islander, 0.7% from other races, and 1.6% from two or more races. Those of Hispanic or Latino origin made up 2.1% of the population.[12] In terms of ancestry, 42.0% were German, 18.2% were Norwegian, 17.7% were Irish, 7.9% were English, 6.8% were Swedish, and 3.7% were American.[14]
Of the 5,756 households, 32.8% had children under the age of 18 living with them, 58.9% were married couples living together, 7.5% had a female householder with no husband present, 29.8% were non-families, and 25.1% of all households were made up of individuals. The average household size was 2.49 and the average family size was 2.98. The median age was 40.2 years.[12]
The median income for a household in the county was $59,889 and the median income for a family was $71,308. Males had a median income of $42,702 versus $31,993 for females. The per capita income for the county was $33,783. About 3.9% of families and 4.9% of the population were below the poverty line, including 4.3% of those under age 18 and 10.5% of those age 65 or over.[15]
Communities
Cities
- Alcester
- Beresford (partial)
- Elk Point (county seat)
- Jefferson
- North Sioux City
Census-designated places
Unincorporated communities
Ghost towns
Townships
Unorganized territory
- Richland
Politics
Union County voters were more politically centered in times past, but the county has selected the Republican Party candidate in every national election since 1996 (as of 2020).
| Year | Republican | Democratic | Third parties |
|---|---|---|---|
| 2020 | 67.1% 5,944 | 30.8% 2,725 | 2.1% 186 |
| 2016 | 67.0% 5,290 | 28.2% 2,227 | 4.8% 380 |
| 2012 | 61.9% 4,698 | 36.6% 2,782 | 1.5% 116 |
| 2008 | 56.0% 4,310 | 42.1% 3,244 | 1.9% 147 |
| 2004 | 56.6% 3,987 | 42.6% 3,000 | 0.9% 61 |
| 2000 | 56.6% 3,265 | 40.9% 2,358 | 2.6% 149 |
| 1996 | 42.9% 2,234 | 45.7% 2,378 | 11.4% 595 |
| 1992 | 35.0% 1,784 | 43.4% 2,210 | 21.6% 1,103 |
| 1988 | 41.9% 1,907 | 57.4% 2,612 | 0.7% 31 |
| 1984 | 52.0% 2,431 | 47.5% 2,221 | 0.5% 25 |
| 1980 | 55.2% 2,788 | 36.2% 1,830 | 8.6% 436 |
| 1976 | 47.3% 2,297 | 52.3% 2,540 | 0.5% 23 |
| 1972 | 46.9% 2,271 | 52.8% 2,554 | 0.4% 17 |
| 1968 | 49.7% 2,212 | 45.3% 2,014 | 5.1% 225 |
| 1964 | 37.9% 1,727 | 62.1% 2,828 | |
| 1960 | 53.6% 2,688 | 46.4% 2,331 | |
| 1956 | 52.9% 2,636 | 47.1% 2,343 | |
| 1952 | 67.4% 3,393 | 32.7% 1,645 | |
| 1948 | 49.4% 2,205 | 50.1% 2,237 | 0.5% 23 |
| 1944 | 54.9% 2,501 | 45.1% 2,057 | |
| 1940 | 54.4% 3,116 | 45.6% 2,608 | |
| 1936 | 31.9% 1,845 | 60.9% 3,520 | 7.3% 420 |
| 1932 | 27.9% 1,381 | 71.2% 3,530 | 0.9% 46 |
| 1928 | 53.2% 2,415 | 46.4% 2,106 | 0.4% 19 |
| 1924 | 45.0% 1,665 | 23.7% 877 | 31.2% 1,155 |
| 1920 | 66.2% 1,942 | 28.7% 841 | 5.2% 152 |
| 1916 | 45.0% 1,108 | 53.3% 1,313 | 1.8% 44 |
| 1912 | 0.0% 0 | 39.1% 965 | 60.9% 1,504 |
| 1908 | 56.6% 1,392 | 41.1% 1,009 | 2.3% 57 |
| 1904 | 68.3% 1,813 | 27.5% 730 | 4.2% 111 |
| 1900 | 53.0% 1,571 | 45.8% 1,358 | 1.2% 35 |
| 1896 | 46.2% 1,297 | 53.2% 1,491 | 0.6% 17 |
| 1892 | 43.3% 860 | 12.1% 241 | 44.6% 885 |
References
- "State & County QuickFacts". United States Census Bureau. Retrieved November 28, 2013.
- "Find a County". National Association of Counties. Retrieved June 7, 2011.
- Union County SD Google Maps (accessed 9 February 2019)
- ""Find an Altitude" Google Maps (accessed 9 February 2019)". Archived from the original on May 21, 2019. Retrieved February 9, 2019.
- "2010 Census Gazetteer Files". US Census Bureau. August 22, 2012. Retrieved March 28, 2015.
- "Annual Estimates of the Resident Population for Counties: April 1, 2010 to July 1, 2019". Retrieved April 10, 2020.
- "US Decennial Census". US Census Bureau. Retrieved March 28, 2015.
- "Historical Census Browser". University of Virginia Library. Retrieved March 28, 2015.
- Forstall, Richard L., ed. (March 27, 1995). "Population of Counties by Decennial Census: 1900 to 1990". US Census Bureau. Retrieved March 28, 2015.
- "Census 2000 PHC-T-4. Ranking Tables for Counties: 1990 and 2000" (PDF). US Census Bureau. April 2, 2001. Retrieved March 28, 2015.
- "U.S. Census website". US Census Bureau. Retrieved May 14, 2011.
- "Profile of General Population and Housing Characteristics: 2010 Demographic Profile Data". US Census Bureau. Archived from the original on February 13, 2020. Retrieved March 12, 2016.
- "Population, Housing Units, Area, and Density: 2010 - County". US Census Bureau. Archived from the original on February 13, 2020. Retrieved March 12, 2016.
- "Selected Social Characteristics in the US – 2006-2010 American Community Survey 5-Year Estimates". US Census Bureau. Archived from the original on February 13, 2020. Retrieved March 12, 2016.
- "Selected Economic Characteristics – 2006-2010 American Community Survey 5-Year Estimates". US Census Bureau. Archived from the original on February 13, 2020. Retrieved March 12, 2016.
- Garryowen SD (WikiMapia - accessed 9 February 2019)
- Texas Cemetery, Dakota Territory ("About Elk Point" - accessed 9 February 2019)
- Leip, David. "Atlas of US Presidential Elections". uselectionatlas.org. Retrieved April 15, 2018.
External links
- Union County Historical Society website
- 2nd Best Place to Live in 2006 from the Progressive Farmer website
Places adjacent to Union County, South Dakota | ||||||||||
|---|---|---|---|---|---|---|---|---|---|---|
| ||||||||||
Municipalities and communities of Union County, South Dakota, United States | ||
|---|---|---|
| Cities | | |
| Townships | ||
| CDPs | ||
| Other unincorporated communities | ||
| Ghost town | ||
| Footnotes | ‡This populated place also has portions in an adjacent county or counties | |
| ||

| Authority control |
|---|