Lac qui Parle County, Minnesota
Lac qui Parle County (/læk kiː ˈpɑːrl/) is a county in the U.S. state of Minnesota. As of the 2010 United States Census, the population was 7,259.[2] Its county seat is Madison.[3]
Lac qui Parle County | |
|---|---|
 | |
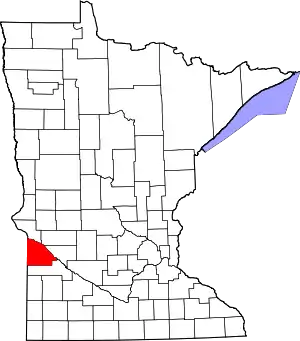 Location within the U.S. state of Minnesota | |
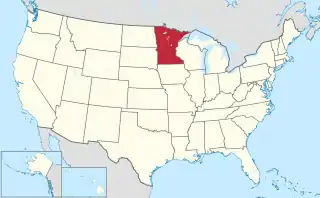 Minnesota's location within the U.S. | |
| Coordinates: 45°00′N 96°11′W | |
| Country | |
| State | |
| Founded | March 6, 1871[1] |
| Named for | "Lake that speaks" French |
| Seat | Madison |
| Largest city | Madison |
| Area | |
| • Total | 778 sq mi (2,020 km2) |
| • Land | 765 sq mi (1,980 km2) |
| • Water | 13 sq mi (30 km2) 1.7%% |
| Population (2010) | |
| • Total | 7,259 |
| • Estimate (2019) | 6,623 |
| • Density | 8.74/sq mi (3.37/km2) |
| Time zone | UTC−6 (Central) |
| • Summer (DST) | UTC−5 (CDT) |
| Congressional district | 7th |
| Website | lqpco |
History
The name of the county is French for "lake which talks."
In 1862 the Minnesota legislature authorized creation of a county to be called Lac qui Parle on an area north of the Minnesota River. However, that initiative was not approved by the local voters affected, so the proposed county did not come into existence. Nine years later (March 6, 1871) the legislature authorized creation of the present Lac qui Parle County, south of the Minnesota River, and it was approved by local voters. The county seat was established at Lac qui Parle village.
In 1884 a settlement was platted at the railway stop in Madison Township (named for Madison, Wisconsin). The settlement, also named Madison, was incorporated in 1885, and in 1889 the county government was moved from Lac qui Parle village to this new town, which incorporated as a city in 1902.[4]
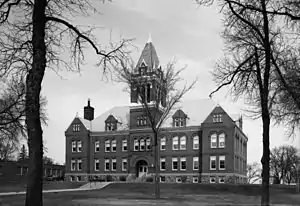
The county courthouse was built in Madison in 1899, and in 1903 the Madison City Hall was completed. A total of four fires swept the city's main area during the early years of the twentieth century, resulting in most wood structures in the area being replaced with brick buildings.[5]
A March 2011 study by the University of Wisconsin–Madison and the Robert Wood Johnson Foundation ranked this as Minnesota's healthiest county.[6][7]
The county reached its peak population of 15,554 in 1920. However, the county seat continued its population growth until 1960, when 2,380 residents were counted.[5]
Geography
Lac Qui Parle County is on the west side of Minnesota. Its west border abuts the east border of the state of South Dakota. The Minnesota River flows southeastward along the county's NE border, creating Marsh Lake and Lac qui Parle Reservoir[8] The Minnesota River flow is augmented by Yellow Bank River near the county's north corner, and by Lac qui Parle River near the county's east border. The south fork of the Yellow Bank flows northward through the west portion of the county, and meets the north fork of the Yellow Bank in the north end of the county; the combined flow discharges into the Minnesota at the county's NE border. The Lac qui Parle flows eastward through the lower portion of the county, discharging into the Minnesota near the community of Lac qui Parle.
The county terrain consists of rolling hills, knolls and short bluffs near the west end, running to a steep bluff overlooking the Minnesota River valley on its east border. The area is largely devoted to agriculture.[9] The terrain slopes to the north and east, with its highest point near its SW corner, at 1,404' (428m) ASL.[10] The county has a total area of 778 square miles (2,020 km2), of which 765 square miles (1,980 km2) is land and 13 square miles (34 km2) (1.7%) is water.[11]
The county's northern boundary is defined by the Minnesota River. Two tributaries, the Lac qui Parle River and the Yellow Bank River, flow through the county to discharge into the Minnesota.[12]
Lakes[9]
- Bolland Slough
- Case Lake
- Flinks Slough (part)
- Kibler Lake
- Lac qui Parle (adjacent to county)
- Marsh Lake (adjacent to county)
- Mud Lake
- Pegg Lake
- Salt Lake (part)
- Swanson Lake
Major highways
Adjacent counties
- Big Stone County - north
- Swift County - northeast
- Chippewa County - east
- Yellow Medicine County - south
- Deuel County, South Dakota - southwest
- Grant County, South Dakota - northwest
Protected areas[9]
- Acton Marsh State Wildlife Management Area
- Big Stone National Wildlife Refuge (part)
- Borchardt-Rosin State Wildlife Management Area
- Church State Wildlife Management Area
- De Vorak State Wildlife Management Area
- Flinks State Wildlife Management Area
- Haydenville State Wildlife Management Area
- Kemen State Wildlife Management Area
- Kibler Scientific and Natural Area
- Lac qui Parle State Park
- Medicine Pipe State Wildlife Management Area
- Plantation State Wildlife Management Area
- Providence State Wildlife Management Area
- Sweetwater State Wildlife Management Area
- Wild Wings Baxter State Wildlife Management Area
- Yellow Bank Hills Scientific and Natural Area
Demographics
| Historical population | |||
|---|---|---|---|
| Census | Pop. | %± | |
| 1870 | 145 | — | |
| 1880 | 4,891 | 3,273.1% | |
| 1890 | 10,382 | 112.3% | |
| 1900 | 14,289 | 37.6% | |
| 1910 | 15,435 | 8.0% | |
| 1920 | 15,554 | 0.8% | |
| 1930 | 15,398 | −1.0% | |
| 1940 | 15,509 | 0.7% | |
| 1950 | 14,545 | −6.2% | |
| 1960 | 13,330 | −8.4% | |
| 1970 | 11,164 | −16.2% | |
| 1980 | 10,592 | −5.1% | |
| 1990 | 8,924 | −15.7% | |
| 2000 | 8,067 | −9.6% | |
| 2010 | 7,259 | −10.0% | |
| 2019 (est.) | 6,623 | [14] | −8.8% |
| US Decennial Census[15] 1790-1960[16] 1900-1990[17] 1990-2000[18] 2010-2019[2] | |||
2000 census
As of the 2000 United States Census, there were 8,067 people, 3,316 households, and 2,225 families in the county. The population density was 10.5/sqmi (4.07/km2). There were 3,774 housing units at an average density of 4.93/sqmi (1.90/km2). The racial makeup of the county was 98.85% White, 0.16% Black or African American, 0.22% Native American, 0.32% Asian, 0.06% from other races, and 0.38% from two or more races. 0.26% of the population were Hispanic or Latino of any race. 44.6% were of Norwegian and 35.2% German ancestry.
There were 3,316 households, out of which 27.90% had children under the age of 18 living with them, 59.80% were married couples living together, 4.10% had a female householder with no husband present, and 32.90% were non-families. 30.20% of all households were made up of individuals, and 17.90% had someone living alone who was 65 years of age or older. The average household size was 2.37 and the average family size was 2.96.
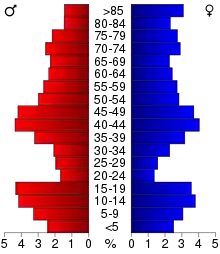
The county population contained 24.50% under the age of 18, 5.70% from 18 to 24, 22.70% from 25 to 44, 23.90% from 45 to 64, and 23.20% who were 65 years of age or older. The median age was 43 years. For every 100 females there were 98.60 males. For every 100 females age 18 and over, there were 95.60 males.
The median income for a household in the county was $32,626, and the median income for a family was $41,556. Males had a median income of $27,939 versus $19,681 for females. The per capita income for the county was $17,399. About 5.60% of families and 8.50% of the population were below the poverty line, including 7.80% of those under age 18 and 9.20% of those age 65 or over.
Communities
Unincorporated communities
Townships
- Agassiz Township
- Arena Township
- Augusta Township
- Baxter Township
- Camp Release Township
- Cerro Gordo Township
- Freeland Township
- Garfield Township
- Hamlin Township
- Hantho Township
- Lac qui Parle Township
- Lake Shore Township
- Madison Township
- Manfred Township
- Maxwell Township
- Mehurin Township
- Perry Township
- Providence Township
- Riverside Township
- Ten Mile Lake Township
- Walter Township
- Yellow Bank Township
Politics
Lac qui Parle County voters have generally voted Democratic the past several decades. In 64% of national elections since 1980, the county selected the Democratic Party candidate (through 2020). More recently, the county has shifted more conservative, voting Republican in both the 2016 and 2020 elections, garnering 59% and 63% of the vote respectively.
| Year | Republican | Democratic | Third parties |
|---|---|---|---|
| 2020 | 62.6% 2,528 | 35.8% 1,446 | 1.6% 66 |
| 2016 | 59.4% 2,293 | 33.8% 1,305 | 6.8% 262 |
| 2012 | 48.6% 1,938 | 49.6% 1,974 | 1.8% 72 |
| 2008 | 45.6% 1,912 | 51.5% 2,160 | 2.9% 120 |
| 2004 | 46.1% 2,093 | 52.6% 2,390 | 1.3% 58 |
| 2000 | 43.6% 1,941 | 50.4% 2,244 | 6.0% 268 |
| 1996 | 32.4% 1,447 | 54.2% 2,420 | 13.4% 598 |
| 1992 | 28.9% 1,435 | 47.1% 2,342 | 24.0% 1,191 |
| 1988 | 42.5% 2,116 | 56.3% 2,805 | 1.2% 62 |
| 1984 | 49.7% 2,731 | 48.8% 2,685 | 1.5% 81 |
| 1980 | 50.5% 2,981 | 41.6% 2,457 | 7.9% 465 |
| 1976 | 37.8% 2,292 | 60.1% 3,647 | 2.1% 126 |
| 1972 | 48.4% 2,773 | 49.7% 2,845 | 1.9% 108 |
| 1968 | 45.9% 2,672 | 50.4% 2,937 | 3.8% 219 |
| 1964 | 36.2% 2,236 | 63.7% 3,934 | 0.2% 10 |
| 1960 | 49.4% 3,185 | 50.4% 3,253 | 0.2% 11 |
| 1956 | 53.6% 3,276 | 46.3% 2,826 | 0.1% 6 |
| 1952 | 58.5% 3,924 | 41.1% 2,753 | 0.4% 28 |
| 1948 | 38.2% 2,330 | 60.5% 3,690 | 1.3% 80 |
| 1944 | 52.6% 3,104 | 47.1% 2,779 | 0.3% 17 |
| 1940 | 54.7% 3,789 | 44.9% 3,106 | 0.4% 28 |
| 1936 | 34.5% 2,066 | 54.1% 3,243 | 11.5% 687 |
| 1932 | 31.9% 1,911 | 66.5% 3,992 | 1.6% 97 |
| 1928 | 59.7% 3,406 | 39.3% 2,245 | 1.0% 59 |
| 1924 | 52.3% 2,860 | 1.9% 106 | 45.8% 2,507 |
| 1920 | 82.3% 4,219 | 12.7% 653 | 5.0% 255 |
| 1916 | 56.3% 1,614 | 36.5% 1,047 | 7.2% 206 |
| 1912 | 13.5% 343 | 24.0% 608 | 62.5% 1,587 |
| 1908 | 69.2% 1,894 | 24.1% 661 | 6.7% 183 |
| 1904 | 83.3% 1,886 | 10.7% 243 | 6.0% 136 |
| 1900 | 71.5% 1,924 | 23.9% 642 | 4.7% 126 |
| 1896 | 61.3% 1,620 | 35.3% 932 | 3.4% 89 |
| 1892 | 52.3% 1,164 | 20.5% 457 | 27.1% 604 |
References
- "Minnesota Place Names". Minnesota Historical Society. Archived from the original on June 20, 2012. Retrieved March 18, 2014.
- "State & County QuickFacts". United States Census Bureau. Archived from the original on June 7, 2011. Retrieved September 1, 2013.
- "Find a County". National Association of Counties. Retrieved June 7, 2011.
- Warren Upham (1920). Minnesota Geographic Names: Their Origin and Historic Significance. Minnesota Historical Society. pp. 288–290.
- Madison (city) website (accessed March 18, 2019)
- Wobbema, Taryn (March 29, 2011). "How healthy are Minnesotans? It varies, report says". Star Tribune. Retrieved September 19, 2018.
- "Rankings". County Health Rankings & Roadmaps. Retrieved September 19, 2018.
- The reservoir was created by damming the Minnesota River in 1939. The dam was rebuilt in 1996.
- Lac Qui Parle County MN Google Maps (accessed 18 March 2019)
- ""Find an Altitude/Lac qui Parle County MN" Google Maps (accessed March 18, 2019)". Archived from the original on May 21, 2019. Retrieved March 18, 2019.
- "2010 Census Gazetteer Files". US Census Bureau. August 22, 2012. Archived from the original on September 21, 2013. Retrieved October 21, 2014.
- Minnesota Atlas & Gazetteer. Yarmouth ME: DeLorme. 1994. pp. 36–37. ISBN 0-89933-222-6.
- Nelson, Steven (2011). Savanna Soils of Minnesota. Minnesota: Self. pp. 69-70. ISBN 978-0-615-50320-2.
- "Population and Housing Unit Estimates". Retrieved March 26, 2020.
- "US Decennial Census". US Census Bureau. Archived from the original on May 12, 2015. Retrieved October 21, 2014.
- "Historical Census Browser". University of Virginia Library. Retrieved October 21, 2014.
- "Population of Counties by Decennial Census: 1900 to 1990". US Census Bureau. Retrieved October 21, 2014.
- "Census 2000 PHC-T-4. Ranking Tables for Counties: 1990 and 2000" (PDF). US Census Bureau. Retrieved October 21, 2014.
- Leip, David. "Atlas of US Presidential Elections". uselectionatlas.org. Retrieved September 19, 2018.
- https://www.sos.state.mn.us/media/4364/mn-2020-state-general-canvassing-report-post-per.pdf
External links
| Wikimedia Commons has media related to Lac qui Parle County, Minnesota. |
Places adjacent to Lac qui Parle County, Minnesota | ||||||||||
|---|---|---|---|---|---|---|---|---|---|---|
| ||||||||||
Municipalities and communities of Lac qui Parle County, Minnesota, United States | ||
|---|---|---|
| Cities | Map of Minnesota highlighting Lac qui Parle County | |
| Townships | ||
| Unincorporated communities | ||
| Footnotes | ‡This populated place also has portions in an adjacent county or counties | |
| ||
| Authority control |
|---|