Chippewa County, Minnesota
Chippewa County is a county in the U.S. state of Minnesota. As of the 2010 United States Census, the population was 12,441.[3] Its county seat is Montevideo.[4] The county was formed in 1862, and was organized in 1868.
Chippewa County | |
|---|---|
 Chippewa County Bank in Montevideo. | |
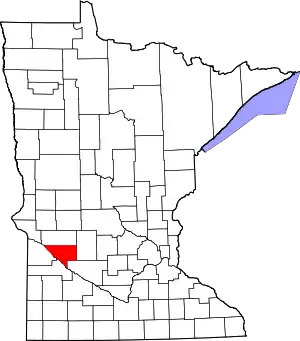 Location within the U.S. state of Minnesota | |
 Minnesota's location within the U.S. | |
| Coordinates: 45°02′N 95°34′W | |
| Country | |
| State | |
| Founded | February 20, 1862 (created) 1868 (organized)[1] |
| Named for | Chippewa River[2] |
| Seat | Montevideo |
| Largest city | Montevideo |
| Area | |
| • Total | 588 sq mi (1,520 km2) |
| • Land | 581 sq mi (1,500 km2) |
| • Water | 6.7 sq mi (17 km2) 1.1%% |
| Population (2010) | |
| • Total | 12,441 |
| • Estimate (2019) | 11,800 |
| • Density | 20.6/sq mi (8.0/km2) |
| Time zone | UTC−6 (Central) |
| • Summer (DST) | UTC−5 (CDT) |
| Congressional district | 7th |
| Website | www |
Geography
The upper part of the county's western boundary is formed by the outline of Lac qui Parle reservoir, which was formed when the Minnesota River was dammed in 1939. The Minnesota River flows southeast from the lake, along the county's southwestern border, while the Chippewa River flows south through the western part of the county to discharge into the Minnesota at the county's southern border. The Dry Weather Creek drains the west-central part of the county into the Chippewa, while the Palmer Creek drains the lower central part of the county into the Minnesota near the county's southernmost point. The county terrain consists of low rolling hills, devoted to agriculture.[6] The terrain generally slopes to the south, and locally to the river valleys. The county's highest point is at its NE corner, at 1,109' (338m) ASL.[7] The county has a total area of 588 square miles (1,520 km2), of which 581 square miles (1,500 km2) is land and 6.7 square miles (17 km2) (1.1%) is water.[8]
Lakes[6]
- Carlton Lake
- Long Lake
- Norboro Lake
- Round Lake
- Shakopee Lake
- Watson Sag
Major highways
 U.S. Highway 59
.svg.png.webp) U.S. Highway 212
U.S. Highway 212 Minnesota State Highway 7
 Minnesota State Highway 23
 Minnesota State Highway 29
 Minnesota State Highway 40
Adjacent counties
- Swift County - north
- Kandiyohi County - northeast
- Renville County - southeast
- Yellow Medicine County - southwest
- Lac qui Parle County - west
Protected areas[6]
- Boike State Wildlife Management Area
- Franko State Wildlife Management Area
- Gneiss Outcrops Scientific and Natural Area
- Minnesota River Valley Overlook
- Spartan State Wildlife Management Area
Climate and weather
| Montevideo, Minnesota | ||||||||||||||||||||||||||||||||||||||||||||||||||||||||||||
|---|---|---|---|---|---|---|---|---|---|---|---|---|---|---|---|---|---|---|---|---|---|---|---|---|---|---|---|---|---|---|---|---|---|---|---|---|---|---|---|---|---|---|---|---|---|---|---|---|---|---|---|---|---|---|---|---|---|---|---|---|
| Climate chart (explanation) | ||||||||||||||||||||||||||||||||||||||||||||||||||||||||||||
| ||||||||||||||||||||||||||||||||||||||||||||||||||||||||||||
| ||||||||||||||||||||||||||||||||||||||||||||||||||||||||||||
In recent years, average temperatures in the county seat of Montevideo have ranged from a low of 2 °F (−17 °C) in January to a high of 83 °F (28 °C) in July, although a record low of −37 °F (−38 °C) was recorded in January 1970 and a record high of 110 °F (43 °C) was recorded in July 1988. Average monthly precipitation ranged from 0.86 inches (22 mm) in December to 4.24 inches (108 mm) in June.[9]
Demographics
| Historical population | |||
|---|---|---|---|
| Census | Pop. | %± | |
| 1870 | 1,467 | — | |
| 1880 | 5,408 | 268.6% | |
| 1890 | 8,555 | 58.2% | |
| 1900 | 12,499 | 46.1% | |
| 1910 | 13,458 | 7.7% | |
| 1920 | 15,720 | 16.8% | |
| 1930 | 15,762 | 0.3% | |
| 1940 | 16,927 | 7.4% | |
| 1950 | 16,739 | −1.1% | |
| 1960 | 16,320 | −2.5% | |
| 1970 | 15,109 | −7.4% | |
| 1980 | 14,941 | −1.1% | |
| 1990 | 13,228 | −11.5% | |
| 2000 | 13,088 | −1.1% | |
| 2010 | 12,441 | −4.9% | |
| 2019 (est.) | 11,800 | [10] | −5.2% |
| US Decennial Census[11] 1790-1960[12] 1900-1990[13] 1990-2000[14] 2010-2019[3] | |||
2000 census
As of the 2000 United States Census,[15] there were 13,088 people, 5,361 households, and 3,597 families in the county. The population density was 22.5/sqmi (8.70/km2). There were 5,855 housing units at an average density of 10.1/sqmi (3.89/km2). The racial makeup of the county was 96.78% White, 0.18% Black or African American, 1.00% Native American, 0.30% Asian, 0.02% Pacific Islander, 0.94% from other races, and 0.79% from two or more races. 1.92% of the population were Hispanic or Latino of any race. 37.8% were of Norwegian and 36.8% German ancestry.
There were 5,361 households, out of which 31.20% had children under the age of 18 living with them, 57.00% were married couples living together, 6.60% had a female householder with no husband present, and 32.90% were non-families. 29.50% of all households were made up of individuals, and 15.70% had someone living alone who was 65 years of age or older. The average household size was 2.39 and the average family size was 2.96.
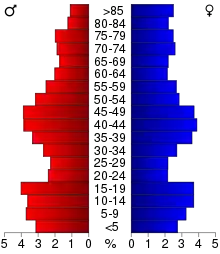
The county population contained 25.40% under the age of 18, 7.10% from 18 to 24, 24.50% from 25 to 44, 23.00% from 45 to 64, and 20.00% who were 65 years of age or older. The median age was 40 years. For every 100 females there were 94.80 males. For every 100 females age 18 and over, there were 91.30 males.
The median income for a household in the county was $35,582, and the median income for a family was $45,160. Males had a median income of $30,556 versus $20,384 for females. The per capita income for the county was $18,039. About 4.80% of families and 8.60% of the population were below the poverty line, including 9.80% of those under age 18 and 9.30% of those age 65 or over.
Communities
Cities
- Clara City
- Granite Falls (partial)
- Maynard
- Milan
- Montevideo (county seat)
- Watson
Unincorporated communities
Government and politics
Chippewa County voters have tended to vote Democratic in recent decades. As of 2016 the county has selected the Democratic nominee in 67% of presidential elections since 1980. Donald Trump was the first Republican nominee to win the county since George W. Bush in 2000, receiving 60.5% of the vote.
| Year | Republican | Democratic | Third parties |
|---|---|---|---|
| 2020 | 64.3% 4,250 | 33.7% 2,226 | 2.0% 135 |
| 2016 | 60.5% 3,764 | 31.8% 1,978 | 7.7% 480 |
| 2012 | 47.9% 2,967 | 49.7% 3,083 | 2.4% 151 |
| 2008 | 45.7% 2,907 | 51.6% 3,280 | 2.7% 169 |
| 2004 | 46.8% 3,089 | 51.8% 3,424 | 1.4% 93 |
| 2000 | 46.9% 2,977 | 46.5% 2,952 | 6.7% 423 |
| 1996 | 34.6% 2,119 | 51.9% 3,178 | 13.5% 827 |
| 1992 | 32.4% 2,143 | 44.3% 2,929 | 23.3% 1,545 |
| 1988 | 49.0% 3,190 | 49.7% 3,238 | 1.3% 86 |
| 1984 | 56.0% 3,964 | 43.0% 3,047 | 1.0% 74 |
| 1980 | 52.5% 4,252 | 39.1% 3,164 | 8.4% 681 |
| 1976 | 40.4% 3,254 | 57.8% 4,648 | 1.8% 144 |
| 1972 | 50.2% 3,787 | 48.1% 3,630 | 1.7% 130 |
| 1968 | 44.7% 3,195 | 51.8% 3,701 | 3.5% 251 |
| 1964 | 38.1% 2,806 | 61.8% 4,550 | 0.1% 9 |
| 1960 | 51.7% 3,915 | 48.1% 3,643 | 0.2% 16 |
| 1956 | 51.3% 3,623 | 48.6% 3,434 | 0.0% 3 |
| 1952 | 57.9% 4,411 | 41.6% 3,171 | 0.5% 36 |
| 1948 | 38.7% 2,569 | 58.5% 3,888 | 2.8% 189 |
| 1944 | 47.3% 2,967 | 52.0% 3,264 | 0.8% 48 |
| 1940 | 45.1% 3,307 | 54.1% 3,969 | 0.9% 64 |
| 1936 | 33.9% 2,223 | 61.4% 4,027 | 4.7% 309 |
| 1932 | 32.4% 1,940 | 65.0% 3,888 | 2.6% 158 |
| 1928 | 62.8% 3,547 | 36.0% 2,032 | 1.3% 72 |
| 1924 | 42.3% 2,140 | 2.8% 140 | 55.0% 2,780 |
| 1920 | 69.8% 3,532 | 19.0% 960 | 11.3% 572 |
| 1916 | 46.8% 1,311 | 40.5% 1,134 | 12.7% 357 |
| 1912 | 15.5% 412 | 32.7% 870 | 51.8% 1,380 |
| 1908 | 59.0% 1,409 | 33.4% 799 | 7.6% 181 |
| 1904 | 79.6% 1,830 | 14.7% 338 | 5.7% 131 |
| 1900 | 63.7% 1,432 | 31.5% 707 | 4.9% 109 |
| 1896 | 54.6% 1,310 | 43.2% 1,037 | 2.2% 52 |
| 1892 | 44.5% 730 | 30.9% 507 | 24.6% 403 |
| Position | Name | District | |
|---|---|---|---|
| Commissioner | Matt Gilbertson | District 1 | |
| Commissioner | Jeffrey Lopez | District 2 | |
| Commissioner | David Nordaune | District 3 | |
| Commissioner | Jim Dahlvang | District 4 | |
| Commissioner | David Lieser | District 5 | |
| Position | Name | Affiliation | District | |
|---|---|---|---|---|
| Senate | Andrew Lang[18] | Republican | District 17 | |
| House of Representatives | Tim Miller[19] | Republican | District 17A | |
| Position | Name | Affiliation | District | |
|---|---|---|---|---|
| House of Representatives | Collin Peterson[20] | Democrat | 7th | |
| Senate | Amy Klobuchar[21] | Democrat | N/A | |
| Senate | Tina Smith[22] | Democrat | N/A | |
References
- "Minnesota Place Names". Minnesota Historical Society. Archived from the original on October 27, 2014. Retrieved March 17, 2014.
- Upham, Warren (1920). Minnesota Geographic Names: Their Origin and Historic Significance. Minnesota Historical Society. p. 102.
- "State & County QuickFacts". United States Census Bureau. Archived from the original on October 27, 2015. Retrieved August 31, 2013.
- "Find a County". National Association of Counties. Archived from the original on May 3, 2015. Retrieved June 7, 2011.
- Nelson, Steven (2011). Savanna Soils of Minnesota. Minnesota: Self. pp. 65-67. ISBN 978-0-615-50320-2.
- Chippewa County MN Google Maps (accessed 6 March 2019)
- ""Find an Altitude/Chippewa County MN" Google Maps (accessed 6 March 2019)". Archived from the original on May 21, 2019. Retrieved March 6, 2019.
- "2010 Census Gazetteer Files". US Census Bureau. August 22, 2012. Archived from the original on October 6, 2014. Retrieved October 6, 2014.
- "Monthly Averages for Montevideo MN". The Weather Channel. Retrieved November 6, 2011.
- "Population and Housing Unit Estimates". Retrieved March 26, 2020.
- "US Decennial Census". US Census Bureau. Retrieved October 6, 2014.
- "Historical Census Browser". University of Virginia Library. Retrieved October 6, 2014.
- "Population of Counties by Decennial Census: 1900 to 1990". US Census Bureau. Retrieved October 6, 2014.
- "Census 2000 PHC-T-4. Ranking Tables for Counties: 1990 and 2000" (PDF). US Census Bureau. Retrieved October 6, 2014.
- "U.S. Census website". US Census Bureau. Retrieved January 31, 2008.
- Leip, David. "Atlas of US Presidential Elections". uselectionatlas.org. Retrieved April 17, 2018.
- "County Commissioners | Chippewa County, MN". www.co.chippewa.mn.us. Retrieved June 24, 2020.
- "MN State Senate". www.senate.mn. Retrieved June 24, 2020.
- "Rep. Tim Miller (17A) - Minnesota House of Representatives". www.house.leg.state.mn.us. Retrieved June 24, 2020.
- "Congressman Collin Peterson". Congressman Collin Peterson. Retrieved June 24, 2020.
- "U.S. Senator Amy Klobuchar". www.klobuchar.senate.gov. Retrieved June 24, 2020.
- "Home". Senator Tina Smith. Retrieved June 24, 2020.
External links
Places adjacent to Chippewa County, Minnesota | ||||||||||
|---|---|---|---|---|---|---|---|---|---|---|
| ||||||||||
Municipalities and communities of Chippewa County, Minnesota, United States | ||
|---|---|---|
| Cities | Map of Minnesota highlighting Chippewa County | |
| Townships | ||
| Unincorporated communities | ||
| Footnotes | ‡This populated place also has portions in an adjacent county or counties | |
| ||
| Authority control |
|---|