Sibley County, Minnesota
Sibley County is a county in the South Central part of the U.S. state of Minnesota. As of the 2010 United States Census, the population was 15,226.[1] Its county seat is Gaylord.[2] Sibley County was part of the Minneapolis-St. Paul-Bloomington, MN-WI Metropolitan Statistical Area from 2013 to September 2018.[3]
Sibley County | |
|---|---|
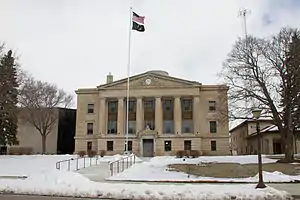 Sibley County Courthouse | |
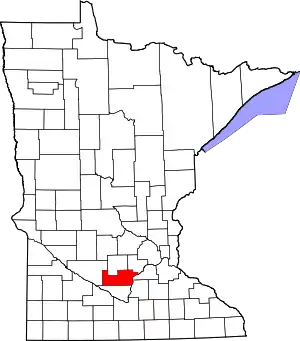 Location within the U.S. state of Minnesota | |
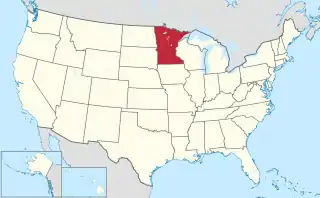 Minnesota's location within the U.S. | |
| Coordinates: 44°35′N 94°14′W | |
| Country | |
| State | |
| Founded | March 5, 1853 |
| Named for | Henry Hastings Sibley |
| Seat | Gaylord |
| Largest city | Gaylord |
| Area | |
| • Total | 601 sq mi (1,560 km2) |
| • Land | 589 sq mi (1,530 km2) |
| • Water | 12 sq mi (30 km2) 2.0%% |
| Population (2010) | |
| • Total | 15,226 |
| • Estimate (2019) | 14,865 |
| • Density | 25.2/sq mi (9.7/km2) |
| Time zone | UTC−6 (Central) |
| • Summer (DST) | UTC−5 (CDT) |
| Congressional district | 7th |
| Website | www |
History
The county was created on 5 March 1853.[4] It was named for Henry Hastings Sibley,[5]
The county seat was first established at Henderson. A courthouse was built there and placed into service in 1879. It was used in that capacity until 1915, when the county seat was moved to Gaylord (after a petition generated by Gaylord residents was presented to County supervisors). Now designated 'Henderson Community Building', the original courthouse presently houses Henderson City offices.[6]
Geography
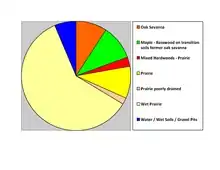
The Minnesota River flows northeastward along the east border of Sibley County. It is fed by the Rush River, whose three branches drain the lower part of the county before merging and then meeting the Minnesota below Henderson. The Bevens Creek drains the upper part of the county, flowing northeastward into Carver County. The county terrain consists of rolling hills etched with drainages and dotted with lakes and ponds, with the area devoted to agriculture.[7] The terrain slopes to the east and north, with its highest point near its NW corner at 1,083' (330m) ASL.[8] The county has an area of 601 square miles (1,560 km2), of which 589 square miles (1,530 km2) is land and 12 square miles (31 km2) (2.0%) is water.[9] Most of the Rush River's watershed is in Sibley County.
Major highways
Adjacent counties
- McLeod County - north
- Carver County - northeast
- Scott County - east
- Le Sueur County - southeast
- Nicollet County - south
- Renville County - west
Lakes[7]
- Altnow Lake: in Dryden Township
- Beatty Lake: in Dryden Township
- Clear Lake: northern half is in Severance Township; southern half is in Nicollet County
- Curran Lake: in Green Isle Township
- Erin Lake
- Hahn Lake: in New Auburn Township
- High Island Lake: in New Auburn Township
- Indian Lake: in Transit Township
- Kerry Lake: in Faxon Township
- Kirby Lake
- Mud Lake: in Dryden Township
- Mud Lake: there is another Mud Lake in New Auburn Township northwest of Hahn Lake
- Mud Lake: there is a third Mud Lake in New Auburn Township southeast of Hahn Lake
- Mud Lake: there is a fourth Mud Lake in Severance Township
- Mud Lakes: three lakes in Washington Lake Township
- Round Grove Lake
- Sand Lake: western two thirds is in Cornish Township; the eastern third is in Alfsborg Township
- Schauer Lake: in Green Isle Township
- Schilling Lake: in New Auburn Township
- Severance Lake: in Green Isle Township
- Silver Lake: in Jessenland Township
- Swan Lake: in Severance Township
- Titlow Lake: in Dryden Township: the North Branch Rush River starts at this lake.
- Ward Lake (part)
- Washington Lake: in Washington Lake Township
Protected areas[7]
- Altnow Marsh State Wildlife Management Area
- Indian Lake State Wildlife Management Area
- Minnesota Valley National Wildlife Refuge (part)
- Revanche Wildlife Management Area
- Rush River County Park
Demographics
| Historical population | |||
|---|---|---|---|
| Census | Pop. | %± | |
| 1860 | 3,609 | — | |
| 1870 | 6,725 | 86.3% | |
| 1880 | 10,637 | 58.2% | |
| 1890 | 15,199 | 42.9% | |
| 1900 | 16,862 | 10.9% | |
| 1910 | 15,540 | −7.8% | |
| 1920 | 15,635 | 0.6% | |
| 1930 | 15,865 | 1.5% | |
| 1940 | 16,625 | 4.8% | |
| 1950 | 15,816 | −4.9% | |
| 1960 | 16,228 | 2.6% | |
| 1970 | 15,845 | −2.4% | |
| 1980 | 15,448 | −2.5% | |
| 1990 | 14,366 | −7.0% | |
| 2000 | 15,356 | 6.9% | |
| 2010 | 15,226 | −0.8% | |
| 2019 (est.) | 14,865 | [11] | −2.4% |
| US Decennial Census[12] 1790-1960[13] 1900-1990[14] 1990-2000[15] 2010-2019[1] | |||
2000 census
As of the 2000 United States Census, there were 15,356 people, 5,772 households, and 4,086 families in the county. The population density was 26.1/sqmi (10.1/km2). There were 6,024 housing units at an average density of 10.2/sqmi (3.95/km2). The racial makeup of the county was 95.57% White, 0.12% Black or African American, 0.26% Native American, 0.33% Asian, 3.09% from other races, and 0.62% from two or more races. 5.43% of the population were Hispanic or Latino of any race. 65.7% were of German and 6.3% Norwegian ancestry.
There were 5,772 households, out of which 33.60% had children under the age of 18 living with them, 61.10% were married couples living together, 5.80% had a female householder with no husband present, and 29.20% were non-families. 25.40% of all households were made up of individuals, and 13.00% had someone living alone who was 65 years of age or older. The average household size was 2.60 and the average family size was 3.14.
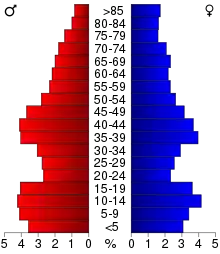
The county population contained 27.70% under the age of 18, 7.50% from 18 to 24, 27.10% from 25 to 44, 21.30% from 45 to 64, and 16.40% who were 65 years of age or older. The median age was 37 years. For every 100 females there were 102.90 males. For every 100 females age 18 and over, there were 99.90 males.
The median income for a household in the county was $41,458, and the median income for a family was $48,923. Males had a median income of $31,002 versus $22,527 for females. The per capita income for the county was $18,004. About 5.10% of families and 8.10% of the population were below the poverty line, including 9.80% of those under age 18 and 7.80% of those age 65 or over.
Communities
Cities
- Arlington
- Gaylord (county seat)
- Gibbon
- Green Isle
- Henderson
- Le Sueur (mostly in Le Sueur County)
- New Auburn
- Winthrop
Unincorporated communities
- Assumption (partial)
- New Rome
- Rush River
Townships
- Alfsborg Township
- Arlington Township
- Bismarck Township
- Cornish Township
- Dryden Township
- Faxon Township
- Grafton Township
- Green Isle Township
- Henderson Township
- Jessenland Township
- Kelso Township
- Moltke Township
- New Auburn Township
- Severance Township
- Sibley Township
- Transit Township
- Washington Lake Township
Politics
During the Third Party System, Sibley was a strongly Democratic county due to the opposition of its German Catholic populace to the pietism of the Republican Party. It voted Democratic at every presidential election until William Jennings Bryan’s Populist-backed free silver campaign drove its voters to William McKinley. Except when voting for Robert La Follette in 1924 and Franklin D. Roosevelt during his two 1930s landslides, Sibley County has been strongly Republican since 1896. It was one of only four Minnesota counties to vote for Barry Goldwater over Lyndon Johnson in 1964, and in no presidential election since 1936 has the Democratic candidate won a majority. In 1992, Sibley was Ross Perot’s strongest county in Minnesota, and he lost by only fourteen votes to Bill Clinton, whose pluralities in this and the 1996 election are the only Democratic victories in Sibley County since 1940.
| Year | Republican | Democratic | Third parties |
|---|---|---|---|
| 2016 | 66.8% 5,193 | 25.1% 1,954 | 8.1% 627 |
| 2012 | 60.1% 4,693 | 37.3% 2,916 | 2.6% 206 |
| 2008 | 58.1% 4,492 | 38.8% 2,998 | 3.1% 239 |
| 2004 | 58.7% 4,669 | 39.1% 3,109 | 2.2% 171 |
| 2000 | 55.7% 4,087 | 36.6% 2,687 | 7.7% 561 |
| 1996 | 39.0% 2,590 | 41.7% 2,769 | 19.4% 1,288 |
| 1992 | 32.2% 2,315 | 33.7% 2,421 | 34.1% 2,449[lower-alpha 1] |
| 1988 | 52.7% 3,655 | 45.5% 3,154 | 1.9% 130 |
| 1984 | 62.1% 4,638 | 37.0% 2,761 | 0.9% 69 |
| 1980 | 58.4% 4,460 | 33.0% 2,521 | 8.7% 661 |
| 1976 | 49.3% 3,871 | 47.7% 3,752 | 3.0% 237 |
| 1972 | 64.2% 4,543 | 34.4% 2,433 | 1.5% 104 |
| 1968 | 59.4% 4,250 | 35.5% 2,540 | 5.1% 364 |
| 1964 | 51.8% 3,854 | 48.1% 3,577 | 0.1% 5 |
| 1960 | 66.1% 4,987 | 33.7% 2,541 | 0.2% 14 |
| 1956 | 69.2% 4,737 | 30.7% 2,099 | 0.1% 6 |
| 1952 | 73.8% 5,323 | 25.9% 1,871 | 0.3% 20 |
| 1948 | 53.0% 3,260 | 45.8% 2,818 | 1.3% 79 |
| 1944 | 71.6% 4,311 | 27.9% 1,683 | 0.5% 30 |
| 1940 | 73.3% 5,564 | 26.2% 1,986 | 0.5% 39 |
| 1936 | 32.4% 2,184 | 61.5% 4,140 | 6.1% 411 |
| 1932 | 22.4% 1,398 | 76.3% 4,756 | 1.3% 82 |
| 1928 | 55.9% 3,301 | 43.3% 2,553 | 0.8% 47 |
| 1924 | 34.6% 1,749 | 6.7% 341 | 58.7% 2,970 |
| 1920 | 85.9% 4,198 | 10.3% 502 | 3.8% 185 |
| 1916 | 62.4% 1,737 | 34.9% 973 | 2.7% 75 |
| 1912 | 15.1% 383 | 35.2% 890 | 49.7% 1,256 |
| 1908 | 57.9% 1,623 | 39.6% 1,110 | 2.5% 69 |
| 1904 | 69.2% 1,628 | 28.2% 662 | 2.6% 62 |
| 1900 | 56.2% 1,736 | 41.2% 1,272 | 2.6% 79 |
| 1896 | 58.0% 1,826 | 39.7% 1,251 | 2.3% 73 |
| 1892 | 37.8% 950 | 47.4% 1,191 | 14.8% 373 |
Notes
- The leading "other" candidate, Independent Ross Perot, received 2,407 votes, while other candidates received the remaining 42 votes.
References
- "State & County QuickFacts". US Census Bureau. Retrieved September 1, 2013.
- "Find a County". National Association of Counties. Archived from the original on May 31, 2011. Retrieved June 7, 2011.
- Bureau, US Census. "Delineation Files". The United States Census Bureau. Retrieved 2021-01-27.
- "Minnesota Place Names". Minnesota Historical Society. Archived from the original on June 20, 2012. Retrieved March 19, 2014.
- Upham, Warren (1920). Minnesota Geographic Names: Their Origin and Historic Significance. Minnesota Historical Society. p. 518.
- Visitors page (Henderson City website)
- Sibley County MN Google Maps (accessed 8 April 2019)
- "Find an Altitude/Sibley County MN" Google Maps (accessed 8 April 2019)
- "2010 Census Gazetteer Files". US Census Bureau. August 22, 2012. Archived from the original on September 21, 2013. Retrieved October 25, 2014.
- Nelson, Steven (2011). Savanna Soils of Minnesota. Minnesota: Self. pp. 65 - 67. ISBN 978-0-615-50320-2.
- "Population and Housing Unit Estimates". Retrieved March 26, 2020.
- "US Decennial Census". US Census Bureau. Archived from the original on April 26, 2015. Retrieved October 25, 2014.
- "Historical Census Browser". University of Virginia Library. Retrieved October 25, 2014.
- "Population of Counties by Decennial Census: 1900 to 1990". US Census Bureau. Retrieved October 25, 2014.
- "Census 2000 PHC-T-4. Ranking Tables for Counties: 1990 and 2000" (PDF). US Census Bureau. Retrieved October 25, 2014.
- Leip, David. "Atlas of US Presidential Elections". Retrieved October 10, 2018.
External links
Places adjacent to Sibley County, Minnesota | ||||||||||
|---|---|---|---|---|---|---|---|---|---|---|
| ||||||||||
Municipalities and communities of Sibley County, Minnesota, United States | ||
|---|---|---|
| Cities | Map of Minnesota highlighting Sibley County | |
| Townships | ||
| Unincorporated communities | ||
| Footnotes | ‡This populated place also has portions in an adjacent county or counties | |
| ||
| Authority control |
|---|