Economy of Minnesota
The economy of Minnesota produced US$312 billion of gross domestic product in 2014.[9] Minnesota headquartered 31 publicly traded companies in the top 1,000 U.S. companies by revenue in 2011.[10] This includes such large companies as Target and UnitedHealth Group. The per capita personal income in 2016 was $51,990, ranking sixteenth in the nation.[11] The median household income in 2013 ranked eleventh in the nation at $60,900.[12]
 | |
| Statistics | |
|---|---|
| GDP | $333.267 billion [1] |
GDP per capita | $53,043 (2017)[2] |
Population below poverty line | 11.5% (2013)[3] |
| 0.4436 (2011)[4] | |
Labor force | 2,995,400 (December 2014)[5] |
| Unemployment | 3.6% (December 2014)[6] |
| Public finances | |
| Revenues | $20,181.8 million (2013)[7] |
| Expenses | $18,739.5 million (2013)[8] |
Industry and commerce

Minnesota's economy has transformed in the past 200 years from one based on raw materials to one based on finished products and services.
The earliest industries were fur trading and agriculture. Agriculture is still a major part of the economy even though only a small percentage of the population, less than 1%, are employed in the farming industry.[13]
Minnesota is the U.S.'s largest producer of sugar beets, sweet corn, and green peas for processing and farm-raised turkeys.[14] State agribusiness has changed from production to processing and the manufacturing of value-added food products by companies such as General Mills, Cargill, Hormel Foods Corporation (prepackaged and processed meat products), and the McDonald Food Company.


Forestry, another early industry, remains strong with logging, pulpwood processing, forest products manufacturing, and paper production. The amount of forested land in the state is declining, from 16.7 million acres (68,000 km²) in 1990 to 16,200,000 acres (66,000 km2) in 2004; however, the average forest is maturing. From 1999 to 2004 the average annual growth within the state was 550 million board-feet (1,300,000 m³) of timber, while the average amount harvested was only 330 million board-feet (780,000 m³) per year.[15]

Minnesota was famous for its soft-ore iron mines which produced a significant portion of the world's iron ore for over a century. Although the pure ore is now depleted, taconite mining remains strong using processes developed locally to save the industry. In 2004 the state produced 75 percent of the usable iron ore in the country.[14] 3M (formerly Minnesota Mining and Manufacturing Co.) today is a diversified manufacturer of industrial and consumer products. The port of Duluth was created by the mining boom and today continues to be an important shipping port for the Midwest's agricultural and ore products.
Manufacturing was not left out, either. The brass era automobile maker Dan Patch was founded in Minneapolis in 1911.[16]
Retail is represented by Target Corporation, Best Buy, and Supervalu, all headquartered in the Twin Cities. Southdale Center, the first fully enclosed and completely climate-controlled shopping mall in the United States opened on October 8, 1956, in the suburban city of Edina. The largest shopping mall in the United States, the Mall of America, is located in Bloomington.
St. Jude Medical represents a growing biomedical industry spawned by university research, and Rochester is the headquarters of the world-famous Mayo Clinic. UnitedHealth Group is the second largest health insurance company in the U.S.
Financial institutions include U.S. Bancorp, Ameriprise and Thrivent Financial for Lutherans.
As might be expected in state with a love of the outdoors, boats and other recreational products are manufactured by a number of Minnesota companies, including Polaris Industries and Arctic Cat, who make snowmobiles and ATVs, Alumacraft Boat Company, and Lund Boats.
Today, the most salient characteristic of the economy is its diversity; the relative outputs of its business sectors closely match the United States as a whole.[17]
The digital state
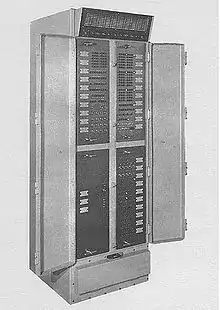
More than any other Midwestern state, Minnesota attracted entrepreneurs and engineers, especially in the computer industry, and became a leading center of computer manufacturing after the war.[18] Engineering Research Associates was formed in 1946 to develop computers for the Navy and the intelligence agencies. It merged with Remington Rand, and soon became a division of Sperry Rand.[19] William Norris, Seymour Cray, and others left Sperry in 1957 to form Control Data Corporation (CDC).[20] Cray Research was formed when Cray left CDC to form his own company. "Minnesota was the undisputed epicenter of top-secret digital computing for decades."[21] Medical device maker Medtronic also was founded in the Twin Cities in 1949. Honeywell was a national force in computing until selling its computer division to Groupe Bull in 1989, remaining a prominent military and aerospace concern headquartered in Minnesota until 1999 when, after a merger, it moved to New Jersey. National firms, such as International Business Machines, moved manufacturing and R&D operations to Minnesota. State government and powerful politicians such as Hubert Humphrey maintained a favorable climate. The Minnesota Educational Computing Consortium brought state-wide networked computing in the 1970s and developed educational software such as the popular "Oregon Trail" game. The Federal Reserve Bank of Minneapolis combined computing power with financial clout across its region from Montana to upper Michigan. The University of Minnesota trained many computer specialists who decided to stay in the Minnesota rather than move to sunny California. Minnesota thus preceded the better-known industrial districts of Route 128 around Boston and Silicon Valley.[22] An active high-technology sector is represented today by Alliant Techsystems, Ceridian, Cray, Digi International, Digital River, Geek Squad, Hutchinson Technology, Imation, IBM Rochester, Lawson Software, MacSoft, Medtronic, MTS Systems, St. Jude Medical, Stratasys, SPS Commerce, 3M, and more than 400 smaller software companies.
Minnesota's largest companies

Nonprofits
The following table lists the Minnesota-based non-profit organizations among the largest 400 in the U.S. by 2006 private donations.[23]
| State Rank by Revenue |
Name | National Rank |
Donations ($millions) 2006 estimate |
Headquarters City |
|---|---|---|---|---|
| 1 | Mayo Clinic | 45 | 265.9 | Rochester |
| 2 | University of Minnesota | 46 | 265.4 | Minneapolis |
| 3 | Scholarship America | 114 | 136.2 | St. Peter |
| 4 | Minnesota Public Radio | 378 | 40.3 | St. Paul |
| 5 | Hope for the City | 379 | 40.3 | Edina |


Private companies
The following table lists the privately held companies headquartered in Minnesota with 2007 revenues over $1 billion.[24]
| State Rank by Revenue |
Company Name | National Rank |
Revenue ($billions) 2007 estimate |
Employees | Headquarters City | Known for |
|---|---|---|---|---|---|---|
| 1 | Cargill | 1 | 107.90 | 131,000 | Minnetonka | Farm Products |
| 2 | Carlson | 87 | 38.00 | 170,000 | Minnetonka | Travel and Lodging |
| 3 | Schwan Food Company | 124 | 3.30 | 17,000 | Marshall | Dairy Products and Frozen Foods |
| 4 | Andersen Corporation | 136 | 3.00 | 10,600 | Bayport | Windows and Building Materials |
| 5 | Rosen's Diversified | 184 | 2.40 | 4,200 | Fairmont | Meat Products |
| 6 | M A Mortenson | 218 | 2.14 | 2,700 | Robbinsdale | Heavy Construction |
| 7 | Fagen | 227 | 2.08 | 3,600 | Granite Falls | Heavy Construction |
| 8 | Holiday Cos. | 238 | 2.00 | 4,600 | Bloomington | Retailing |
| 9 | Taylor Corp. | 286 | 1.70 | 12,500 | North Mankato | Publishing – Periodicals |
| 10 | Ceridian | 295 | 1.65 | 9,500 | Bloomington | Information Technology Services |
| 11 | Buffets, Inc. | 334 | 1.46 | 38,000 | Eagan | Restaurants |
| 12 | API Group | 351 | 1.35 | 6,000 | New Brighton | Conglomerates |
| 13 | Lifetouch | 424 | 1.05 | 20,000 | Eden Prairie | Photography |
| 14 | Ryan Companies | 427 | 1.04 | 600 | Minneapolis | Heavy Construction |

Public companies
The following table lists the public companies headquartered in Minnesota with 2010 revenues placing them in the 1000 largest U.S. companies.[10]
| State Rank by Revenue |
Company Name | National Rank |
Revenue ($millions) 2010 estimate |
Headquarters City | Known for |
|---|---|---|---|---|---|
| 1 | UnitedHealth Group | 6 | 184,840 | Minnetonka | Managed Health Care |
| 2 | Target | 33 | 67,390 | Minneapolis | Retailing |
| 3 | Best Buy | 47 | 49,694 | Richfield | Retailing |
| 4 | Supervalu | 61 | 40,597 | Eden Prairie | Food Distribution and Retailing |
| 5 | 3M | 97 | 26,692 | Maplewood | Diversified Manufacturing |
| 6 | CHS, Inc. | 103 | 25,268 | Inver Grove Heights | Fuel Distribution |
| 7 | US Bancorp | 126 | 20,518 | Minneapolis | Banking and Finance |
| 8 | General Mills | 166 | 14,796 | Golden Valley | Food Processing |
| 9 | Land O' Lakes | 218 | 11,146 | Arden Hills | Dairy Products |
| 10 | Xcel Energy | 237 | 10,311 | Minneapolis | Electricity Production and Distribution |
| 11 | Ameriprise | 246 | 10,046 | Minneapolis | Financial Planning |
| 12 | C.H. Robinson Worldwide | 265 | 9,274 | Eden Prairie | Logistic Services |
| 13 | Thrivent Financial for Lutherans | 318 | 7,471 | Minneapolis | Financial Products |
| 14 | Hormel Foods | 325 | 7,221 | Austin | Meat Processing |
| 15 | Mosaic | 346 | 6,759 | Plymouth | Fertilizer Manufacturing |
| 16 | Ecolab | 378 | 6,090 | St. Paul | Sanitation Supplier |
| 17 | St. Jude Medical | 436 | 5,165 | Little Canada | Medical Devices |
| 18 | Nash Finch | 449 | 4,992 | Edina | Food Distribution |
| 19 | Alliant Techsystems | 472 | 4,808 | Eden Prairie | Defense Contractor |
| 20 | Valspar | 618 | 3,482 | Minneapolis | Paint and Coatings |
| 21 | Pentair | 627 | 3,395 | Golden Valley | Water Treatment |
| 22 | Patterson | 687 | 2,999 | Eagan | Dental and Veterinarian Supplies |
| 23 | Securian/Minnesota Life | 729 | 2,746 | St. Paul | Life Insurance |
| 24 | Regis | 730 | 2,739 | Edina | Hair Salons |
| 25 | Fastenal | 813 | 2,340 | Winona | Fastener Manufacturer |
| 26 | Donaldson | 836 | 2,233 | Bloomington | Filtration Products |
| 27 | Imation | 860 | 2,155 | Oakdale | Data Storage Products |
| 28 | Polaris Industries | 911 | 1,948 | Medina | Snowmobiles and ATVs |
| 29 | Toro | 936 | 1,878 | Bloomington | Lawn and Irrigation Equipment |
| 30 | Michael Foods | 961 | 1,804 | Minnetonka | Packaged Foods |
Energy use and production

The state does not produce any petroleum of its own but boasts the largest oil refinery of any non-oil-producing state, the Pine Bend Refinery. As of 2001, Minnesotans were using a total of 7.2 million US gallons (27,000 m3) of gasoline per day, and fuel use rises in the region by about 2% annually. About 70% of the gasoline fuel used in the state comes from Pine Bend and the nearby St. Paul Park Refinery, while most of the rest comes from a combination of the Mandan Refinery in North Dakota, and the Superior Refinery in Superior, Wisconsin. 40 to 50% of Pine Bend's output is used within the state. Flint Hills is currently planning a $100 million expansion to increase capacity at the plant to about 330,000 barrels per day (52,000 m3/d). Petroleum from the north comes to the state through one of the longest pipelines in the world, the Lakehead Pipeline and the Minnesota Pipeline. Additional crude comes from the south via the Wood River Pipeline.

Ethanol fuel is produced in the state, and consumer gasoline is required to contain 10% ethanol (E10). As of 2006, Minnesota is the only U.S. state with such a mandate. 20% ethanol (E20) will be mandated in 2013.[25] Minnesota has the highest number of fuel stations offering E85 fuel, with 300 statewide.[26] A 2% biodiesel blend has also been required in diesel fuel since 2005. Electricity-producing wind turbines have become popular, particularly in the windy southwest region on the Buffalo Ridge. As of November 2006, the state is the country's fourth-largest producer of wind power, with 812 megawatts installed and another 82 megawatts planned.[27]
Like other Midwestern states that experience cold winters, Minnesota is heavily dependent on natural gas for home heating. Just over two-thirds of homes use the fuel.
State taxes
Minnesota's income tax is slightly progressive with four rates, 5.35%, 7.05%, 7.85%, and 9.85%.[28] The sales tax in Minnesota for most items is 6.875% effective July 1, 2009.[29] The state does not charge sales tax on clothing, some services, or food items for home consumption.[30] The state legislature may allow municipalities to institute local sales taxes and special local taxes, such as the 0.5% supplemental sales tax in Minneapolis.[31] The cities of St. Paul, Rochester, Duluth and St. Cloud have similar taxes. Excise taxes are levied on alcohol, tobacco, and motor fuel. The state imposes a use tax on items purchased elsewhere but used within Minnesota. Owners of real property in Minnesota pay property tax to their county, municipality, school district, and special taxing districts. The overall state and local tax burden is calculated to average 11.9% in 2006, ranking 4th highest in the country.[32]
References
- http://research.stlouisfed.org/fred2/graph/?id=MNNGSP
- http://research.stlouisfed.org/fred2/graph/?id=MNPCPI
- "Archived copy". Archived from the original on December 2, 2006. Retrieved November 21, 2012.CS1 maint: archived copy as title (link)
- "Archived copy". Archived from the original on August 31, 2015. Retrieved 2015-09-01.CS1 maint: archived copy as title (link)
- http://www.bls.gov/eag/eag.mn.htm
- http://research.stlouisfed.org/fred2/data/MNUR.txt
- "Archived copy" (PDF). Archived from the original (PDF) on April 3, 2015. Retrieved March 2, 2015.CS1 maint: archived copy as title (link)
- "Archived copy" (PDF). Archived from the original (PDF) on March 17, 2015. Retrieved March 2, 2015.CS1 maint: archived copy as title (link)
- "Economic Recovery Widespread Across States in 2010" (PDF). U.S. Department of Commerce. 2010. Archived from the original (PDF) on July 19, 2011. Retrieved March 9, 2018.
- "Fortune 500 2007". Our annual ranking of America's largest corporations. CNNMoney.com; Cable News Network LP, LLLP. A Time Warner Company. 2007. Retrieved May 11, 2007.
- "Real Personal Income for States and Metropolitan Areas, 2016" (PDF). U.S. Department of Commerce. Archived (PDF) from the original on November 6, 2018. Retrieved November 5, 2018.
- see Census Bureau, "State Median Income" Archived February 21, 2016, at the Wayback Machine
- "DP-3. Profile of Selected Economic Characteristics: 2000". U.S. Census Bureau. Archived from the original on February 12, 2020. Retrieved 2006-12-12.
- "Wealth of Resources". Positively Minnesota. Minnesota Department of Employment and Economic Development. 2006. Retrieved December 13, 2006.
- "Minnesota's Forest Resources 2004" (PDF). U.S. Dept. of Agriculture. Retrieved December 12, 2006.
- Named for the horse. Clymer, Floyd. Treasury of Early American Automobiles, 1877–1925 (New York: Bonanza Books, 1950), p.158.
- "Environmental Information Report, App. D Socioeconomic Information" (PDF). May 30, 2003. Archived from the original (PDF) on April 6, 2008. Retrieved 2006-11-19.
- "Solid State: Minnesota's High-Tech History" https://www.tpt.org/solid-state/ (Twin Cities PBS 2019).
- Arthur Norberg, Computers and Commerce: A Study of Technology and Management at Eckert-Mauchly Computer Company, Engineering Research Associates, and Remington Rand, 1946-1957 (MIT Press 2005).
- Control Data Corporation Records at Charles Babbage Institute, University of Minnesota.
- Kevin Dragseth, "How MN Became the Land of 10,000 Top-Secret Computer Projects" https://www.tptoriginals.org/how-mn-became-the-land-of-10000-top-secret-computer-projects/ pointing to TPT's 2019 documentary Solid State: Minnesota’s High-Tech History
- Thomas J. Misa, Digital State: The Story of Minnesota's Computing Industry (2013) JSTOR
- "Philanthropy 400: Minnesota". The Chronicle of Philanthropy. 2006. Retrieved May 20, 2007.
- Reifman, Shlomo and Murphy, Andrea D (eds.) (November 3, 2008). "America's Largest Private Companies". Forbes. Retrieved October 27, 2009.CS1 maint: multiple names: authors list (link) CS1 maint: extra text: authors list (link)
- "2005 Senate Bill 4 (Ethanol Mandate Increase)". Minnesota Votes. Archived from the original on June 29, 2006. Retrieved November 26, 2006.
- "Consumer Info and Services". Minnesota Department of Commerce. Archived from Minnesota Commerce : E85 Fuel Station List the original Check
|url=value (help) on October 12, 2006. Retrieved October 19, 2006. - "Wind Energy Projects Throughout the United States of America". The American Wind Energy Association. Archived from the original on April 6, 2007. Retrieved November 26, 2006.
- "Minnesota income tax rates and brakets". Minnesota Department of Revenue. Archived from the original on September 21, 2017. Retrieved September 8, 2017.
- "General sales and use tax rate increases to 6.875% beginning July 1, 2009". Minnesota Department of Revenue. Archived from the original on September 3, 2009. Retrieved September 9, 2009.
- "Sales tax fact sheets". Minnesota Department of Revenue. Archived from the original on July 3, 2007. Retrieved November 26, 2006.
- "Local Sales Tax and Use" (PDF). Archived from the original (PDF) on October 9, 2006. Retrieved November 26, 2006.
- "Minnesota State-Local Tax Burden Compared to U.S. Average (1970–2006)" (PDF). Tax Foundation. 2006. Archived from the original (PDF) on December 1, 2006.
External links
Business
- Start a Business in Minnesota
- Small Business Community of Minnesota
- Small business Administration of Minnesota
- Minnesota Office of the Secretary of State forms and documents
- Thomas J. Misa, Digital State: The Story of Minnesota's Computing Industry (University of Minnesota Press 2013 and JSTOR)