List of Minnesota weather records
The following is a list of Minnesota weather records observed at various stations across the state during the last 100 years. Minnesota is a state in the Upper Midwestern region of the United States. Due to its location in the northern plains of the United States its climate is one of extremes. Minnesota's history of nearly continuous meteorological record keeping stretches back two centuries to 1819 when Fort Snelling was settled. By 1871 the first official government observations were taking place in the Twin Cities and by the early 20th century most statewide stations that exist today were in operation.[1][2]

Weather observations being taken in Minneapolis, Minnesota in 1890.
Temperature
Overall
The 1936 North American heat wave caused record-setting temperatures in eight US states.
| Event[3] | Measurement | Date | Location |
|---|---|---|---|
| Highest Temperature | 114 °F (45.6 °C) | July 29, 1917 July 6, 1936 | Beardsley Moorhead |
| Lowest Temperature | −60 °F (−51.1 °C) | February 2, 1996 | Tower |
| Largest single-day change | 71 °F (39 °C) | April 3, 1982 | Lamberton |
By month
| Event[1] | Measurement | Date | Location |
|---|---|---|---|
| January | |||
| Highest Temperature | 69 °F (21 °C) | January 24, 1981 | Montevideo |
| Lowest Temperature | −57 °F (−49 °C) | January 20, 1996 | Embarrass |
| February | |||
| Highest Temperature | 76 °F (24 °C) | February 26, 1896 | Pleasant Mound |
| Lowest Temperature | −60 °F (−51 °C) | February 2, 1996 | Tower |
| March | |||
| Highest Temperature | 88 °F (31 °C) | March 23, 1910 | Montevideo |
| Lowest Temperature | −50 °F (−46 °C) | March 2, 1897 | Pine City |
| April | |||
| Highest Temperature | 101 °F (38 °C) | April 22, 1980 | Hawley |
| Lowest Temperature | −22 °F (−30 °C) | April 6, 1979 | Karlstad |
| May | |||
| Highest Temperature | 112 °F (44 °C) | May 31, 1934 | Maple Plain |
| Lowest Temperature | 4 °F (−16 °C) | May 1, 1909 May 2, 1909 | Pine River |
| June | |||
| Highest Temperature | 110 °F (43 °C) | June 29, 1931 | Canby |
| Lowest Temperature | 15 °F (−9 °C) | June 1, 1964 | Bigfork |
| July | |||
| Highest Temperature | 114 °F (46 °C) | July 29, 1917 July 6, 1936 | Beardsley Moorhead |
| Lowest Temperature | 24 °F (−4 °C) | July 7, 1997 | Tower |
| August | |||
| Highest Temperature | 110 °F (43 °C) | August 10, 1947 August 1, 1988 | Beardsley Montevideo |
| Lowest Temperature | 21 °F (−6 °C) | August 28, 1996 August 2, 2002 | Tower Kelliher |
| September | |||
| Highest Temperature | 111 °F (44 °C) | September 11, 1931 | Beardsley |
| Lowest Temperature | 10 °F (−12 °C) | September 30, 1930 September 22, 1974 | Big Falls Thorhult |
| October | |||
| Highest Temperature | 98 °F (37 °C) | October 5, 1963 | Beardsley |
| Lowest Temperature | −16 °F (−27 °C) | October 26, 1936 | Roseau |
| November | |||
| Highest Temperature | 84 °F (29 °C) | November 1, 1950 | Winona |
| Lowest Temperature | −45 °F (−43 °C) | November 30, 1896 | Pine City |
| December | |||
| Highest Temperature | 74 °F (23 °C) | December 9, 1939 | Wheaton |
| Lowest Temperature | −57 °F (−49 °C) | December 31, 1898 | Pine City |
Precipitation

Map of Minnesota showing the snowfall totals from the 1991 Halloween Blizzard.
| Event[3] | Measurement | Date | Location |
|---|---|---|---|
| Most yearly precip (one location) | 60.21 inches (1,529 mm) | 2018 | Harmony |
| Least yearly precip (one location) | 6.37 inches (162 mm) | 1976 | Ortonville |
| Most yearly precip (State average) | 33.92 inches (862 mm)[4] | 1977 | Statewide |
| Longest dry spell | 79 days | November 9, 1943 - January 26, 1944 | Beardsley, Canby, Marshall, Dawson |
Rain
| Event | Measurement | Date | Location |
|---|---|---|---|
| Most rain in 24 hours[5] | 15.10 inches (384 mm) | August 18–19, 2007 | Hokah |
| Most rain in one month[6] | 23.86 inches (606 mm) | August 2007 | Hokah |
Snow
| Event[3] | Measurement | Date | Location |
|---|---|---|---|
| Earliest recorded snow[1] | Trace | August 31, 1949 | Duluth |
| Earliest measurable snow | 0.3 inch (1 cm) | September 14, 1964 | International Falls |
| Latest recorded snow | 1.5 inches (4 cm) | June 4, 1935 | Mizpah |
| Most snow, 24 hours | 36 inches (91 cm) | January 7, 1994 | Lake County |
| Most snow, one storm | 47 inches (119 cm) | January 6–8, 1994 | Lake County |
| Most snow, one month[7] | 66 inches (168 cm) | March, 1965 | Collegeville |
| Most snow, season | 170 inches (432 cm) | 1949 – 1950 | Grand Portage State Park |
| Deepest snowpack[7] | 75 inches (191 cm) | March 28, 1950 | Pigeon River Bridge |
| Most fatalities, winter storm[8] | up to 200 | January 12–13, 1888 | Statewide |
Tornadoes
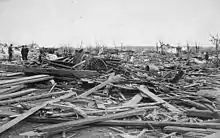
Damage from the 1886 Sauk Rapids tornado, Minnesota's deadliest tornado on record.
| Event[9] | Date | Location | |
|---|---|---|---|
| Most in one day | 48[10] | June 17, 2010 | Statewide |
| Most in one month | 71 | June 2010 | Statewide |
| Most in one year | 113 | 2010 | Statewide |
| Earliest in season[11] | March 6, 2017 | Faribault County | |
| Earliest outbreak in season (2 or more)[12] | 3 | March 6, 2017 | Sherburne, Faribault, and Freeborn Counties |
| Latest in season | November 16, 1931 | Maple Plain | |
| Most fatalities, single tornado | 72 | April 14, 1886 | St. Cloud, Sauk Rapids, Rice |
| Most intense damage measured[13] | F5 | June 13, 1968 June 16, 1992 | Tracy Chandler |
| Longest track (broken path)[14] | 110 miles (177 km) | August 26, 1977 | Otter Tail, Wadena, Cass, Crow Wing counties |
| Longest track (continuous path)[14] | 67 miles (108 km) | March 29, 1998 | Murray, Cottonwood, Brown, Watonwan, Blue Earth, Nicollet counties |
| Biggest outbreak | 48 | June 2010 Northern Plains tornado outbreak | Statewide |
Hail
| Event[15][16] | Measurement | Date | Location |
|---|---|---|---|
| Largest hailstone | 6 inches (15 cm) dia. | July 4, 1968 July 28, 1986 | Edgerton Reading |
Flooding

A bridge connecting East Grand Forks, Minnesota to Grand Forks, North Dakota is submerged during the record flooding of the Red River in 1997.[17]
Record flood stages for selected cities in Minnesota
| Event | Measurement | Date | Location |
|---|---|---|---|
| Middle Fork, Whitewater River | |||
| Highest flood stage[18] | 19.24 ft | August 19, 2007 | Whitewater State Park |
| Root River | |||
| Highest flood stage[18] | 18.75 ft | August 19, 2007 | Houston |
| Red River of the North | |||
| Highest flood stage[19] | 40.82 ft | March 28, 2009 | Moorhead |
| Highest flood stage[20] | 54.35 ft | April 22, 1997 | East Grand Forks |
| Minnesota River | |||
| Highest flood stage[21] | 23.90 ft | April 6, 1997 | Montevideo |
| Highest flood stage[22] | 35.07 ft | April 12, 1965 | Jordan |
| Mississippi River | |||
| Highest flood stage[23] | 26.01 ft | April 16, 1965 | St. Paul |
| Highest flood stage[24] | 20.77 ft | April 19, 1965 | Winona |
Other records

The area of Low pressure that caused the United States' lowest recorded continental atmospheric pressure on October 26, 2010
over Minnesota
| Event | Measurement | Date | Location |
|---|---|---|---|
| Highest Pressure[3] | 31.11 inHg (1053.5 mb) | January 21, 1922 | Collegeville |
| Lowest Pressure[25] | 28.21 inHg (956 mb)[26] | October 26, 2010 | Bigfork |
| Highest dew point | 88 °F (31 °C) | July 18, 2011 July 19, 2011 | Madison Moorhead |
| Highest heat index | 134 °F (57 °C) | July 19, 2011 | Moorhead |
| Lowest wind chill (estimated)[3] | −100 °F (−73 °C) (old formula) −77 °F (−61 °C) (new formula) | January 9-10, 1982 – January 29, 2019 | Northern Minnesota Thief River Falls |
| Highest wind (sustained)[27] | 121 mph (194 km/h) | September 1, 2011 | Donaldson |
| Highest wind (gust)[1] | 180 mph (290 km/h) | August 20, 1904 | St. Paul |
See also
- General
- Large-scale events that affected Minnesota
- 2007 Midwest flooding
- Mid-June 1992 Tornado Outbreak
- 1968 Tracy tornado
- Halloween Blizzard
- Great Storm of 1975
- 1936 North American heat wave
- 1997 Red River Flood
- Armistice Day Blizzard
References
- Seeley W., Mark (2006). Minnesota Weather Almanac. Minnesota Historical Society press. ISBN 0-87351-554-4.
- "History of the NWS in the Twin Cities". National Weather Service - Twin Cities. November 9, 2005. Retrieved 2007-06-19.
- "Climate Extremes for Minnesota". Minnesota Climatology Office. September 6, 2011. Archived from the original on October 5, 2006. Retrieved 2012-03-12.
- http://climate.umn.edu/doc/journal/warm_wet_2010.htm
- "New 24-hour precipitation record established in Minnesota". National Weather Service. August 23, 2007. Retrieved 2007-08-24.
- "Monthly Minnesota Rainfall Record Broken". Minnesota Climatology Office. October 18, 2007. Archived from the original on May 14, 2008. Retrieved 2007-10-19.
- "Minnesota Snowfall and Snow Depth Extremes". National Climatic Data Center. December 3, 2007. Retrieved 2008-02-01.
- "Famous Minnesota Winter Storms". Minnesota State Climatology Office. March 2, 2007. Archived from the original on January 7, 2009. Retrieved 2007-06-28.
- "Minnesota Tornado History and Statistics". Minnesota Climatology Office. May 21, 2007. Archived from the original on August 11, 2007. Retrieved 2007-06-19.
- http://www.crh.noaa.gov/images/mpx/2010torlist.pdf
- https://mesonet.agron.iastate.edu/wx/afos/p.php?pil=PNSMPX&e=201703191949
- "Summary of March 06 2017 Severe Weather Outbreak". National Weather Service - Twin Cities. March 7, 2017.
- "F5 Tornadoes of the United States". Storm Prediction Center.
- "How Historically Unusual Was This?". The Southern Minnesota Tornadoes of March 29, 1998. NWS - Twin Cities. March 6, 2008. Retrieved 2008-05-08.
- "NCDC Storm Event Database". NCDC. 1950–2006. Retrieved 2007-06-24.
- "NCDC Storm Event Database". NCDC. 1950–2006. Retrieved 2007-06-24.
- Macek-Rowland, K.M. (April 13, 2005). "1997 Floods in the Red River of the North and Missouri River Basins in North Dakota and Western Minnesota". U.S. Geological Survey. Retrieved 2007-07-11.
- "Historic Rainfall and Flooding Event of August 18-20, 2007". NOAA. Retrieved 2007-08-31.
- "RED RIVER OF THE NORTH AT FARGO, ND". U.S. Geological Survey. Retrieved 2009-06-18.
- "RED RIVER OF THE NORTH AT GRAND FORKS, ND" (PDF). U.S. Geological Survey. Archived from the original (pdf) on 2007-12-03. Retrieved 2007-07-20.
- "MINNESOTA RIVER NEAR MONTEVIDEO, MN" (PDF). U.S. Geological Survey. Archived from the original (pdf) on 2007-12-03. Retrieved 2007-07-20.
- "MINNESOTA RIVER NEAR ALEXANDRIA, MN" (PDF). U.S. Geological Survey. Archived from the original (pdf) on 2007-12-03. Retrieved 2007-07-20.
- "MISSISSIPPI RIVER AT ST. PAUL, MN" (PDF). U.S. Geological Survey. Archived from the original (pdf) on 2007-12-03. Retrieved 2007-07-20.
- "MISSISSIPPI RIVER AT WINONA, MN" (PDF). U.S. Geological Survey. Archived from the original (pdf) on 2007-12-03. Retrieved 2007-07-20.
- "Storm Data and Unusual Weather Phenomena" (PDF). NOAA. Retrieved 2006-11-20.
- "Record Low Pressure Hits Minnesota October 26-27, 2010". Minnesota Climatology Office. October 28, 2010. Archived from the original on October 31, 2010. Retrieved 2010-10-29.
- http://www.startribune.com/local/129169613.html
External links

This article is issued from Wikipedia. The text is licensed under Creative Commons - Attribution - Sharealike. Additional terms may apply for the media files.